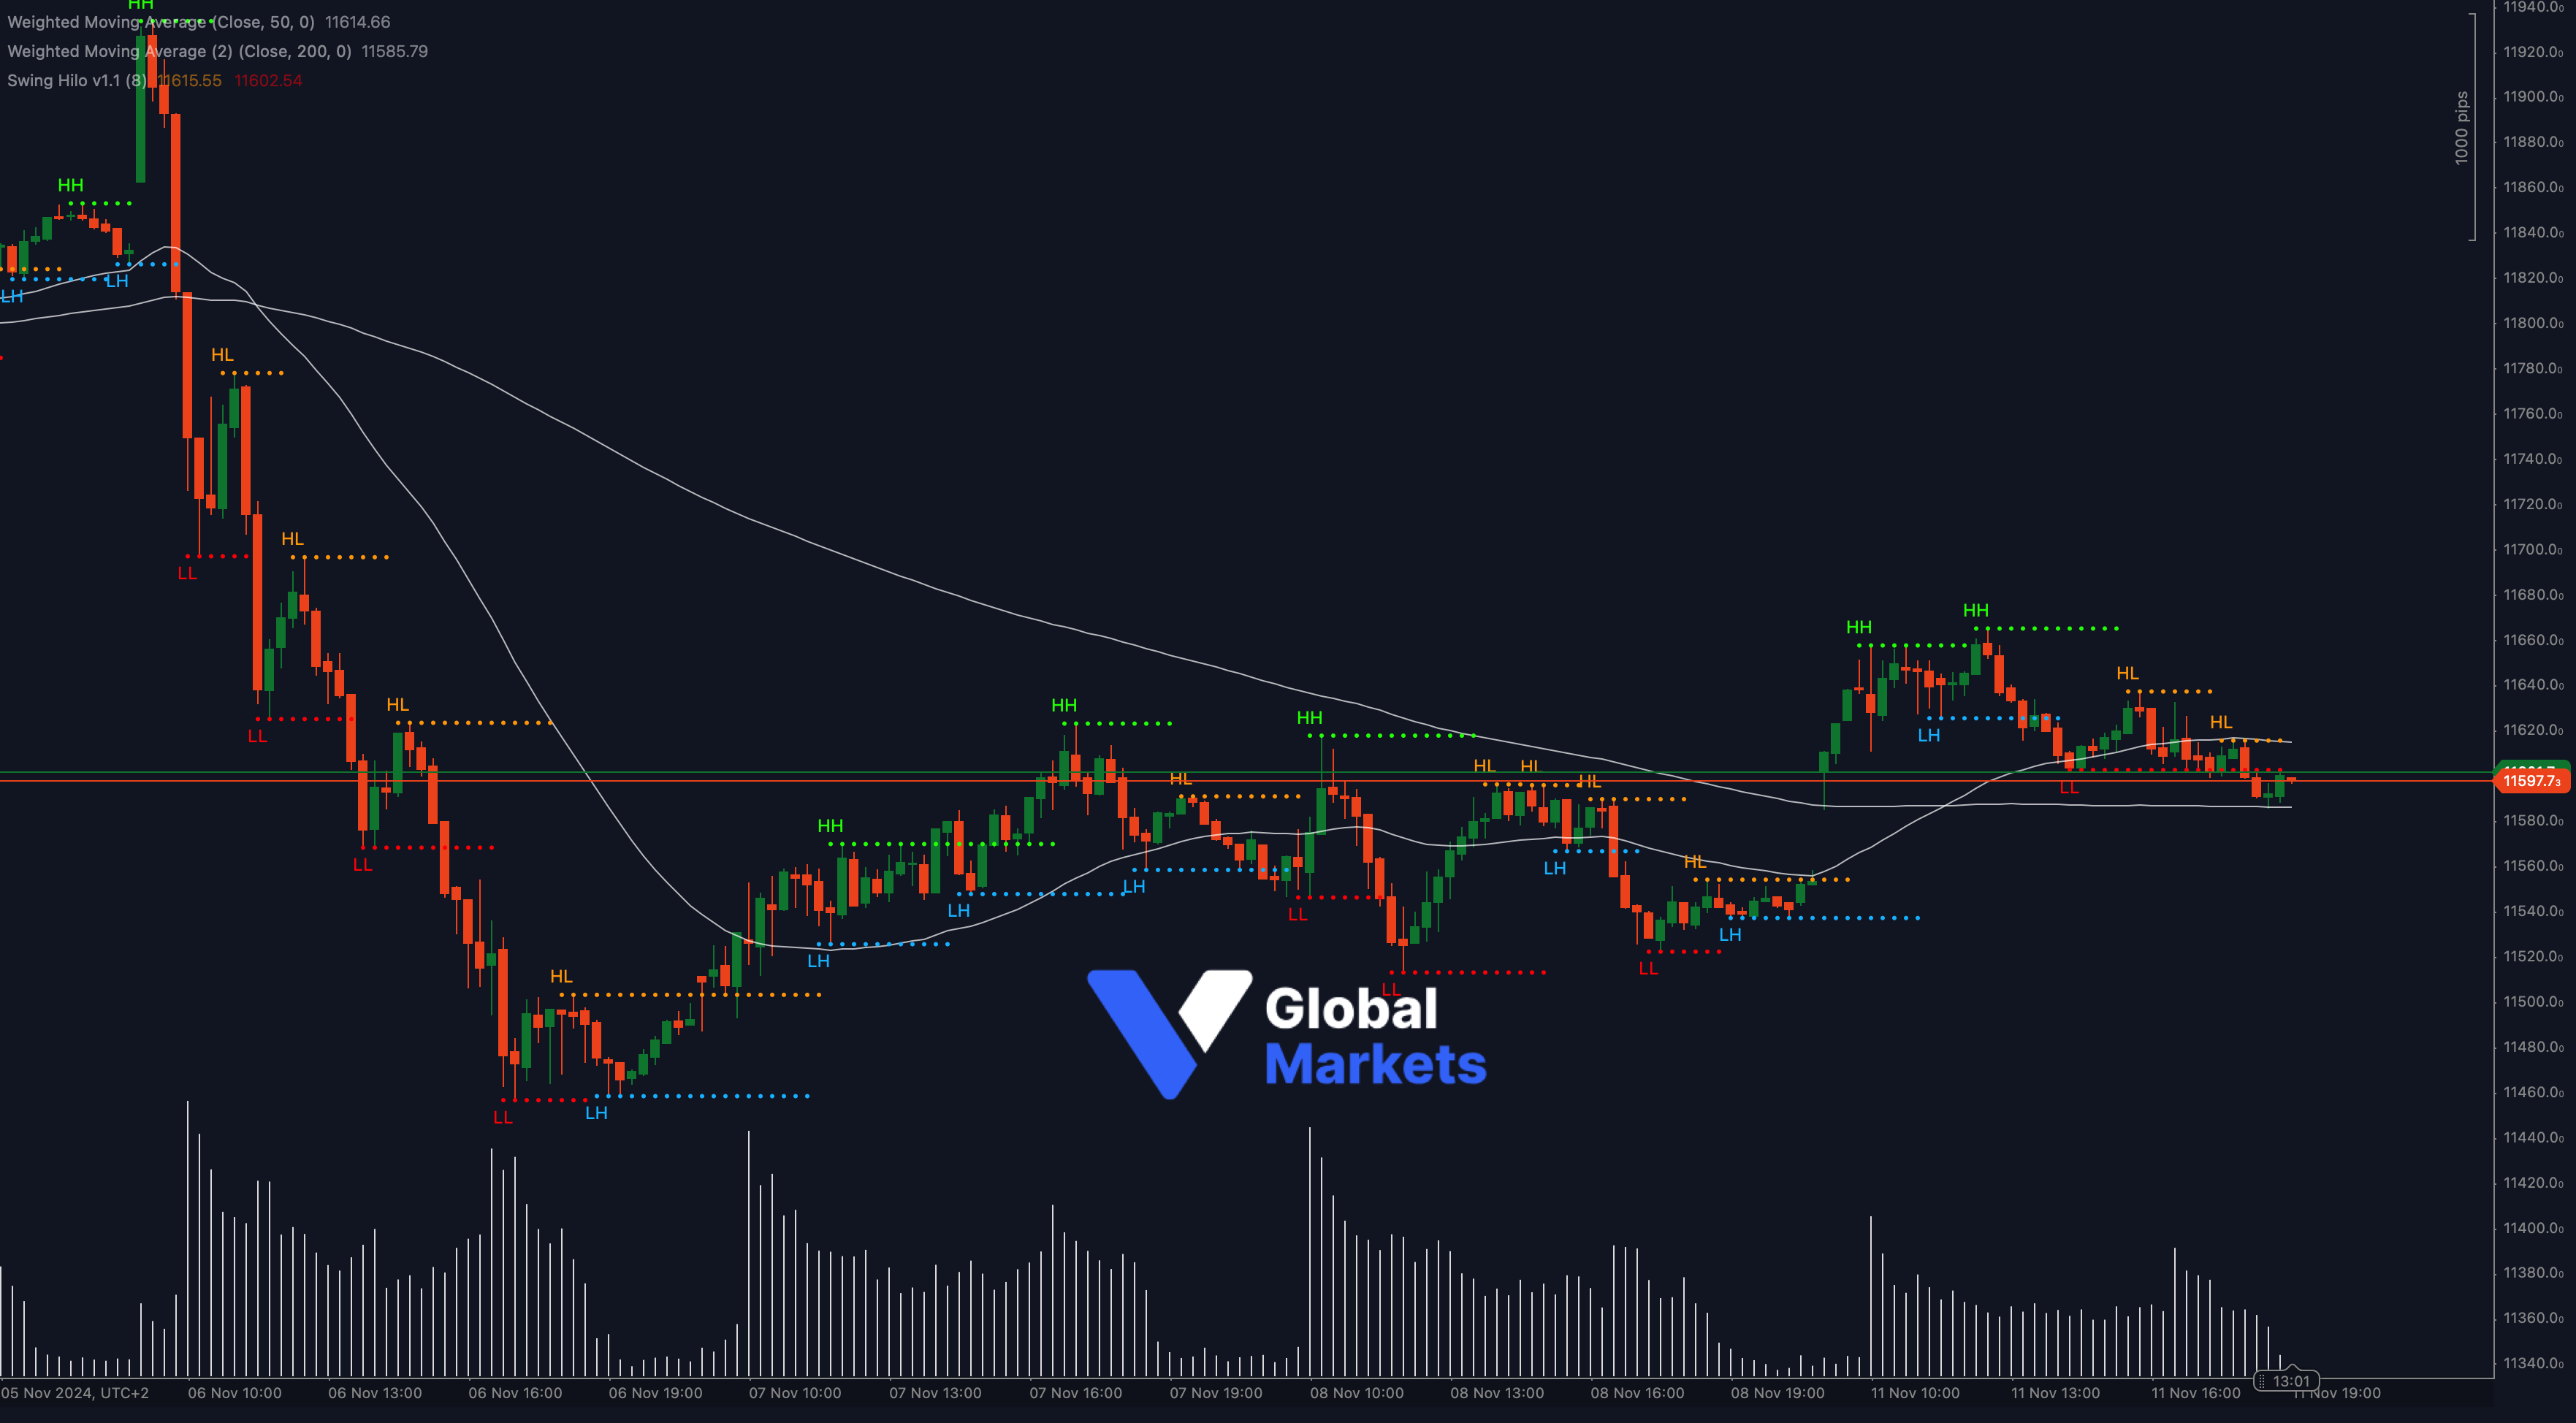
Technical Analysis:
The ESP35 index is currently testing a significant support level at 11,580, with the 50-period WMA (11,614.66) positioned just above, and the 200-period WMA (11,585.79) slightly lower. This convergence near the support zone is a critical decision point, as breaking below this level could lead to further bearish momentum, while a rebound may signal potential recovery.
A successful break below 11,580 could target lower levels around 11,500 and 11,450. Conversely, a strong bounce from this support might bring resistance at 11,700 and 11,750 back into focus.
Support: 🔻 11,580, 11,500
Resistance: 🔺 11,700, 11,750
Moving Averages:
📉 ESP35 is situated near the 50-WMA and 200-WMA, creating a substantial support zone. A decisive move below these averages could shift the momentum in favor of the bears.
Volume:
📊 Increasing volume as the ESP35 nears this key support level suggests heightened market interest. High volume on a breakdown could support further downside movement.
Key Levels to Watch:
Support: 11,580, 11,500
Resistance: 11,700, 11,750
Outlook:
🚩 The ESP35 is at a pivotal level near 11,580. A breakdown could open the door for further losses, while a strong rebound could signal recovery toward resistance levels.
Fundamental Analysis:
The ESP35 index remains influenced by broader Eurozone economic trends and recent shifts in global financial markets. Economic data and central bank policies are closely watched by investors, as these factors could affect the index’s movement near this key support level.
#ESP35 #IndexAnalysis #TechnicalAnalysis #ForexMarket #Trading #VGlobalMarkets #MarketOutlook #ctrader
