Technical Analysis:
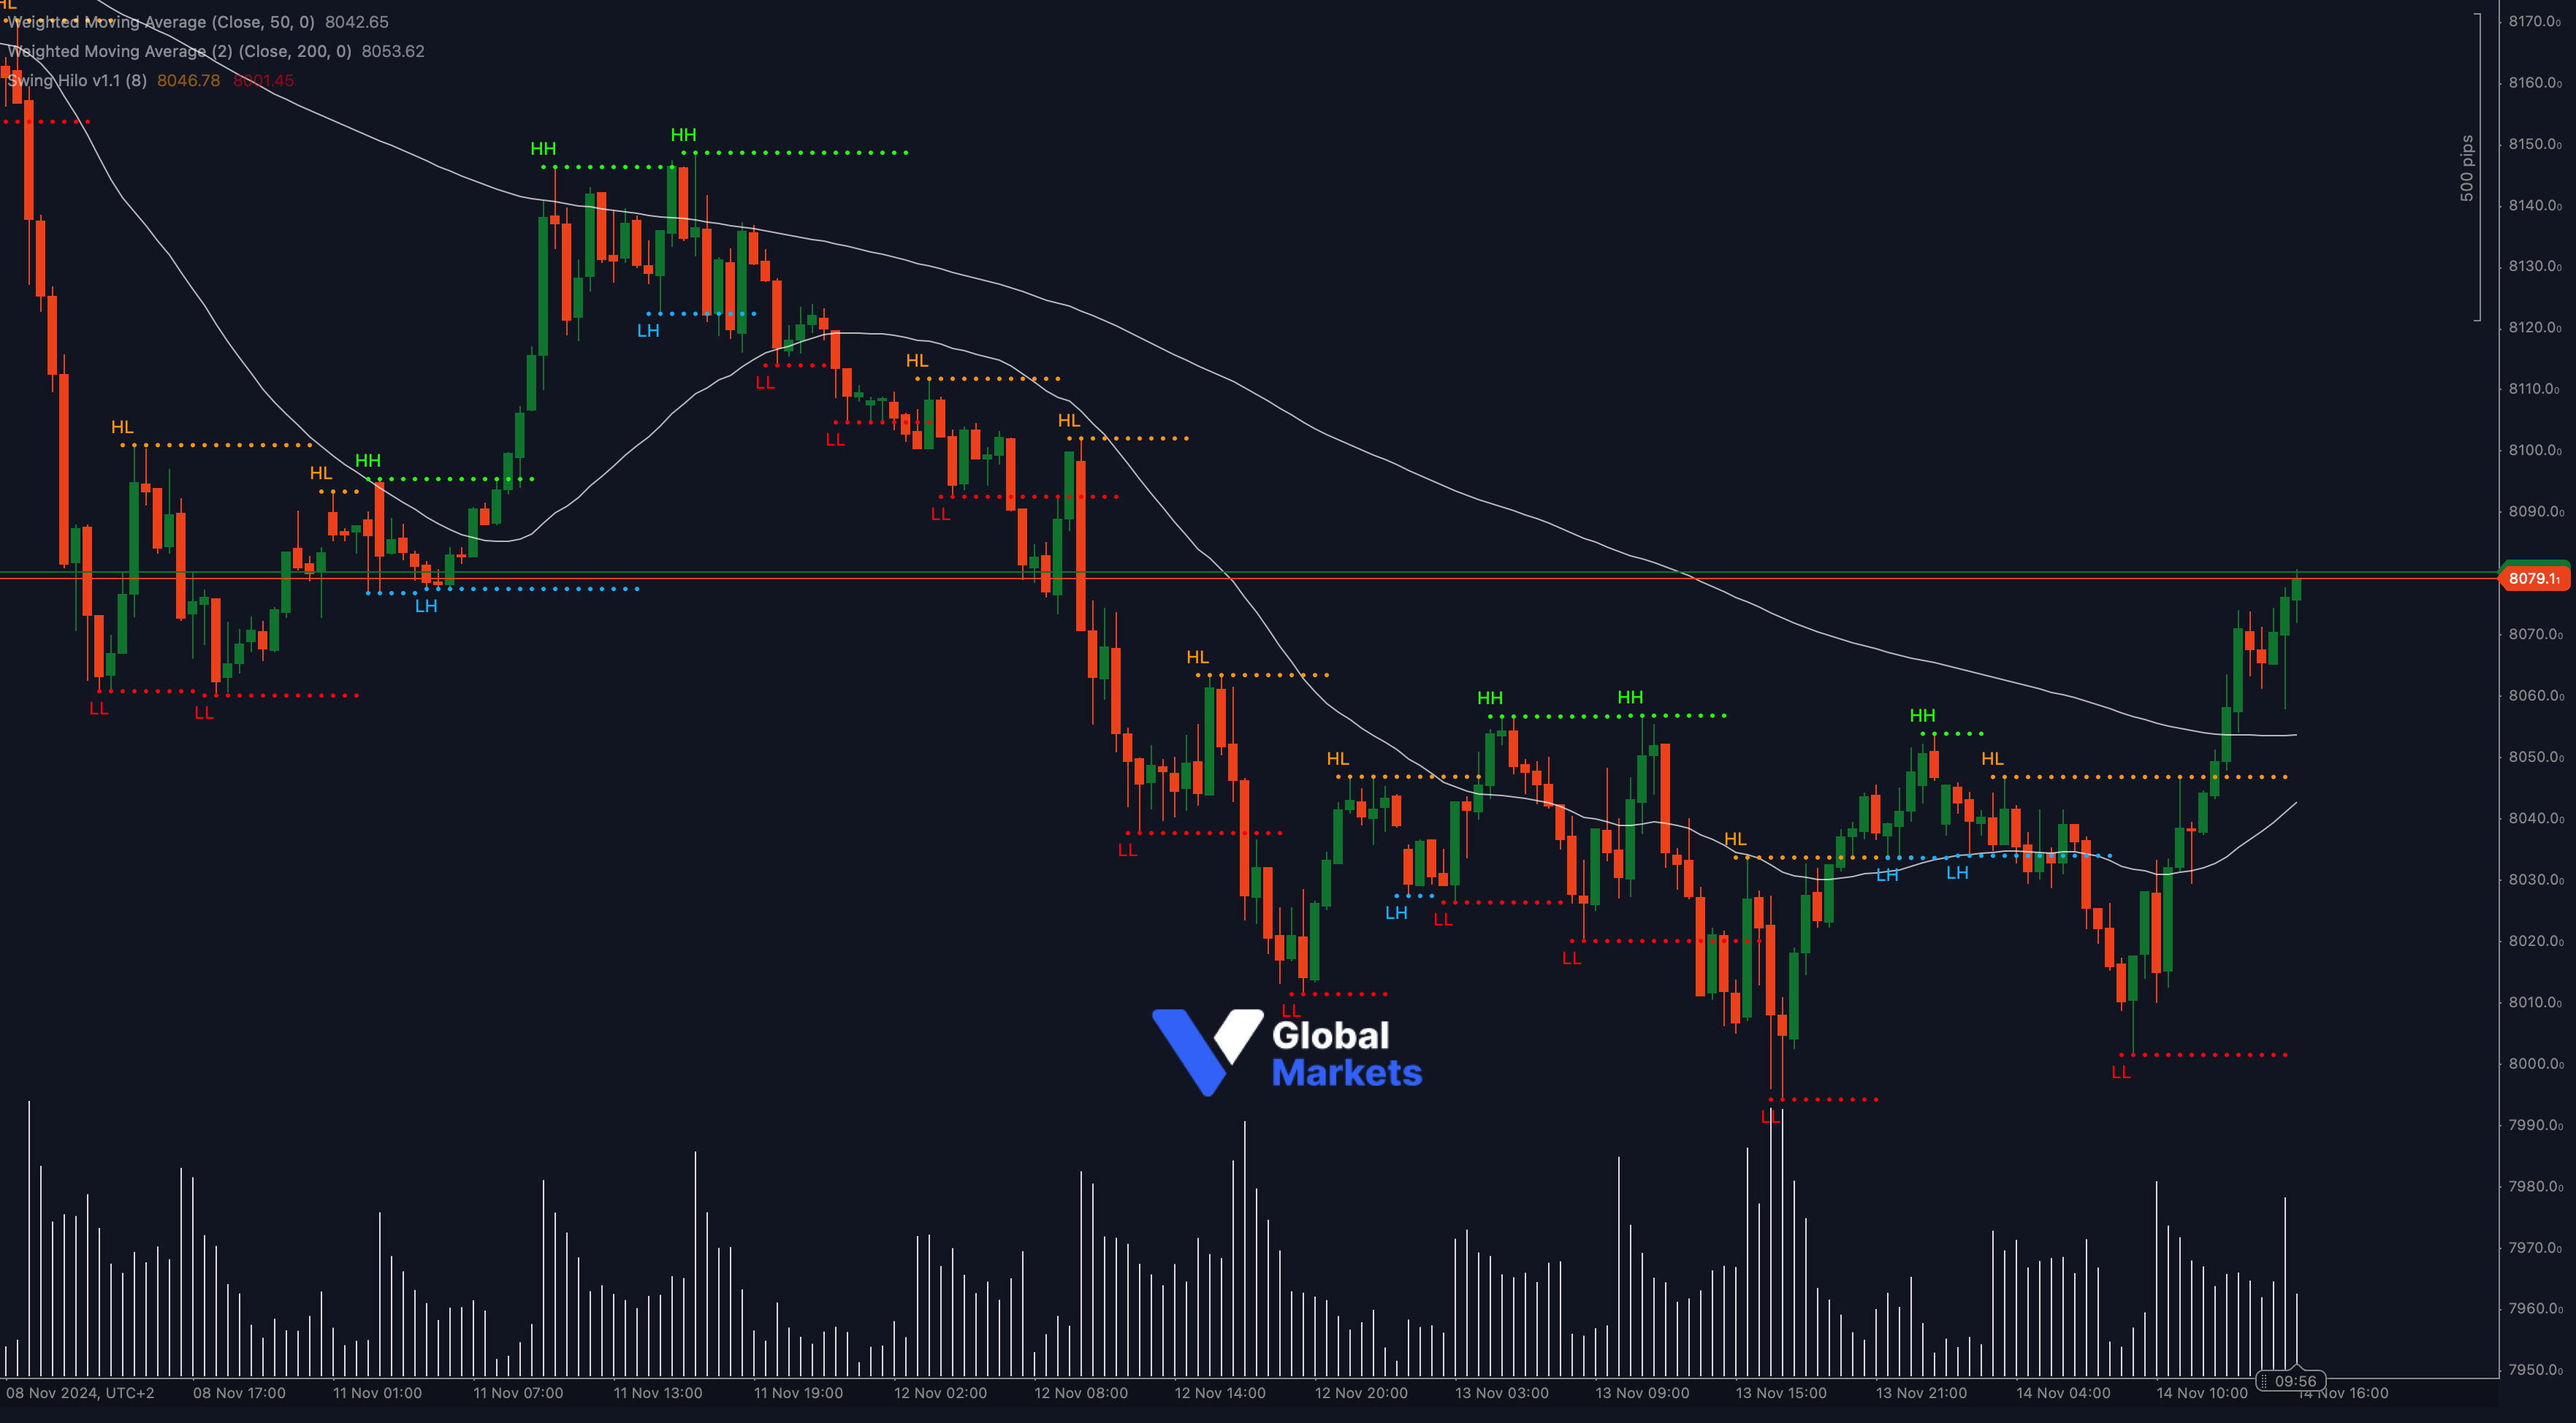
The UK100 index is currently testing a key resistance level at 8079.1, with the 50-period WMA (8042.65) positioned below and the 200-period WMA (8053.62) slightly lower. This setup suggests a potential upward shift if the index successfully breaks above this level. A series of higher highs (HH) and higher lows (HL) further supports the bullish sentiment.
A breakout above 8079.1 could target higher levels around 8100 and 8150. On the downside, a failure to break above this resistance might bring support into focus around 8040 and 8000.
Support: 🔻 8040, 8000
Resistance: 🔺 8079.1, 8100
Moving Averages:
📉 UK100 is trading above both the 50-WMA and 200-WMA, reinforcing a bullish outlook. A decisive move above the current resistance could confirm an upward momentum.
Volume:
📊 Rising volume as UK100 approaches this resistance level suggests strong interest. High volume on a breakout could support further upside movement.
Key Levels to Watch:
Support: 8040, 8000
Resistance: 8079.1, 8100
Outlook:
🚩 UK100 is at a critical resistance near 8079.1. A breakout could indicate further gains, while a rejection may signal consolidation or potential pullback.
Fundamental Analysis:
The UK100 index reflects investor sentiment towards the UK economy. Market participants are closely monitoring economic data and central bank policy statements, as these could impact the index’s movement near this key resistance level.
#UK100 #FTSE100 #TechnicalAnalysis #ForexMarket #Trading #VGlobalMarkets #MarketOutlook #ctrader
