Technical Analysis:
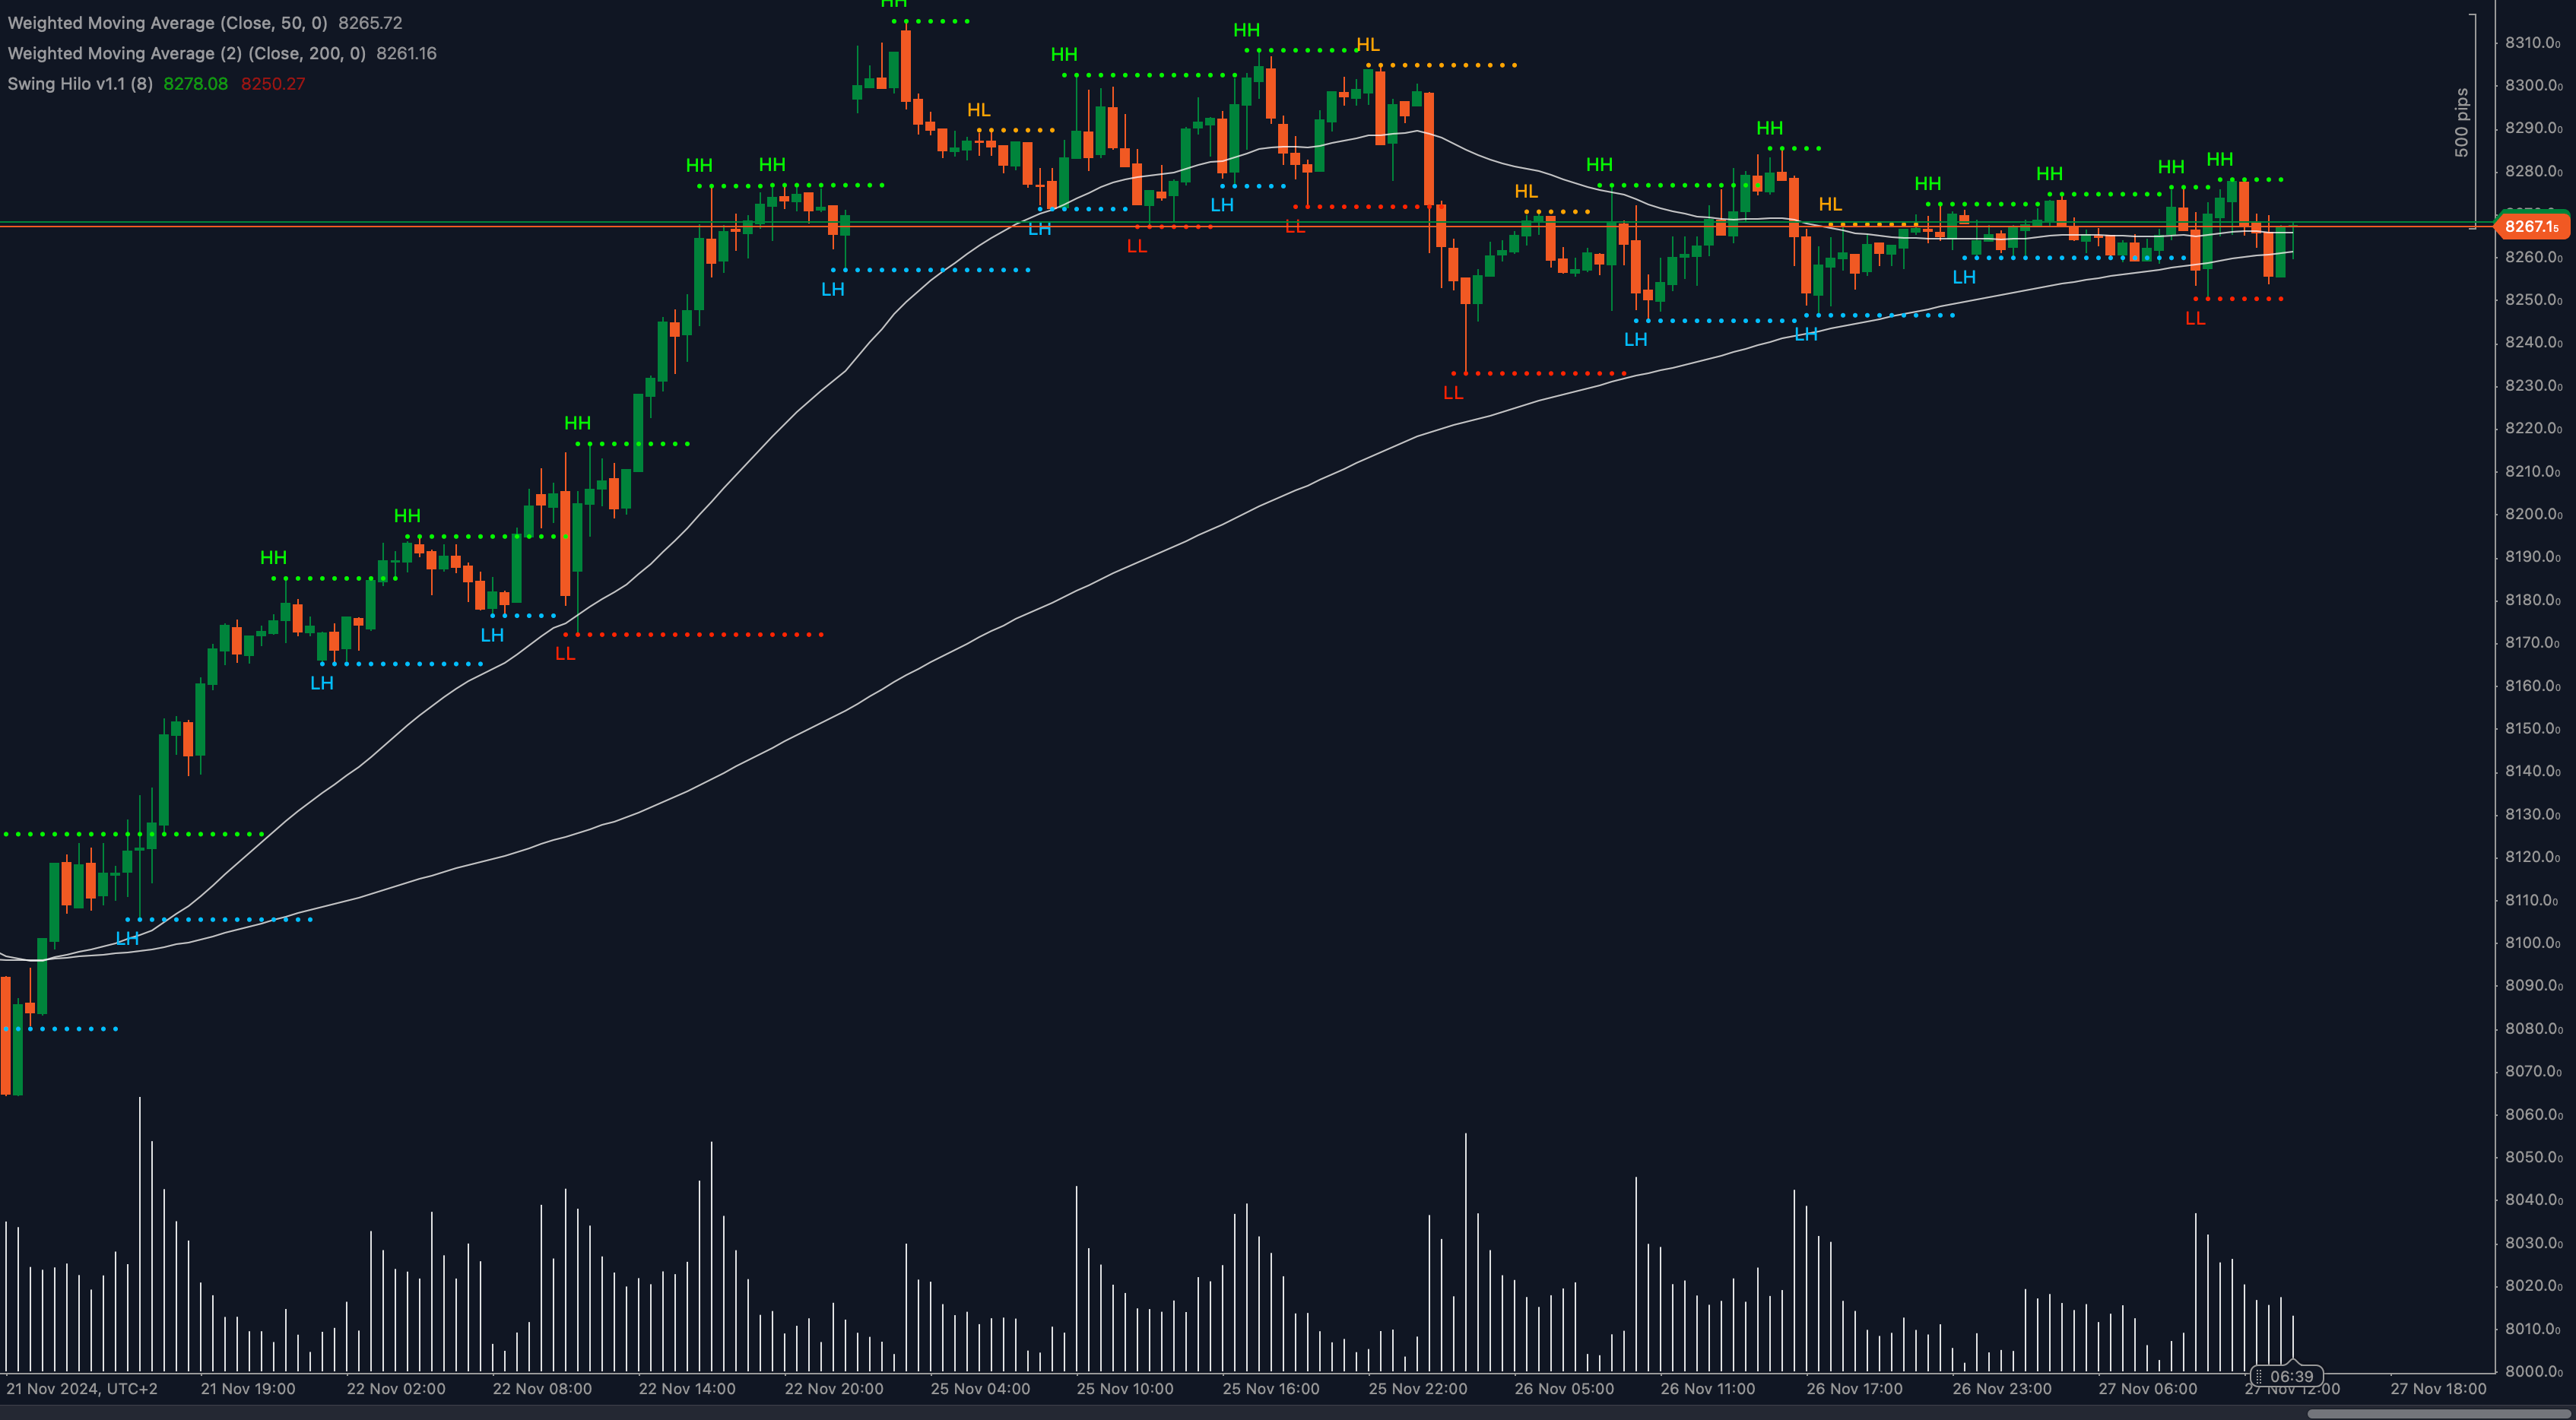
The UK100 index is consolidating near 8267, a key resistance level that aligns with recent price action. The ascending triangle pattern visible on the chart reflects increasing bullish momentum as higher lows form consistently. This suggests buyers are preparing for a breakout, but resistance at 8270 remains a formidable barrier.
The Relative Strength Index (RSI) is at 54, signaling neutral momentum but leaning slightly bullish. Volume has been subdued during the consolidation, often indicative of an imminent volatile move. The 50-period moving average (8265) is acting as immediate support, while the 200-period moving average (8261) adds further structural strength below.
If buyers break above 8270, the index could target 8300 and potentially 8320, key psychological and historical resistance levels. However, failure to clear this level may see prices retreat toward 8240 and 8220, previous support zones.
Key Levels to Watch:
- Support: 8240, 8220
- Resistance: 8270, 8300
Volume and Sentiment:
📊 Volume trends suggest reduced activity, reflecting cautious sentiment among market participants. A breakout above 8270 with rising volume could validate bullish momentum.
Outlook:
The UK100 is at a crossroads, with the ascending triangle pattern favoring an upside breakout. However, failure to sustain above 8267 could lead to a pullback before any significant directional move.
Fundamental Analysis:
The UK100 is closely tied to investor sentiment around global equity markets, Brexit developments, and UK economic data. With risk sentiment fluctuating, upcoming GDP data and central bank commentary may drive the next major move.
#UK100 #FTSE100 #ForexAnalysis #StockIndices #TradingStrategy #ctrader #MarketUpdate
