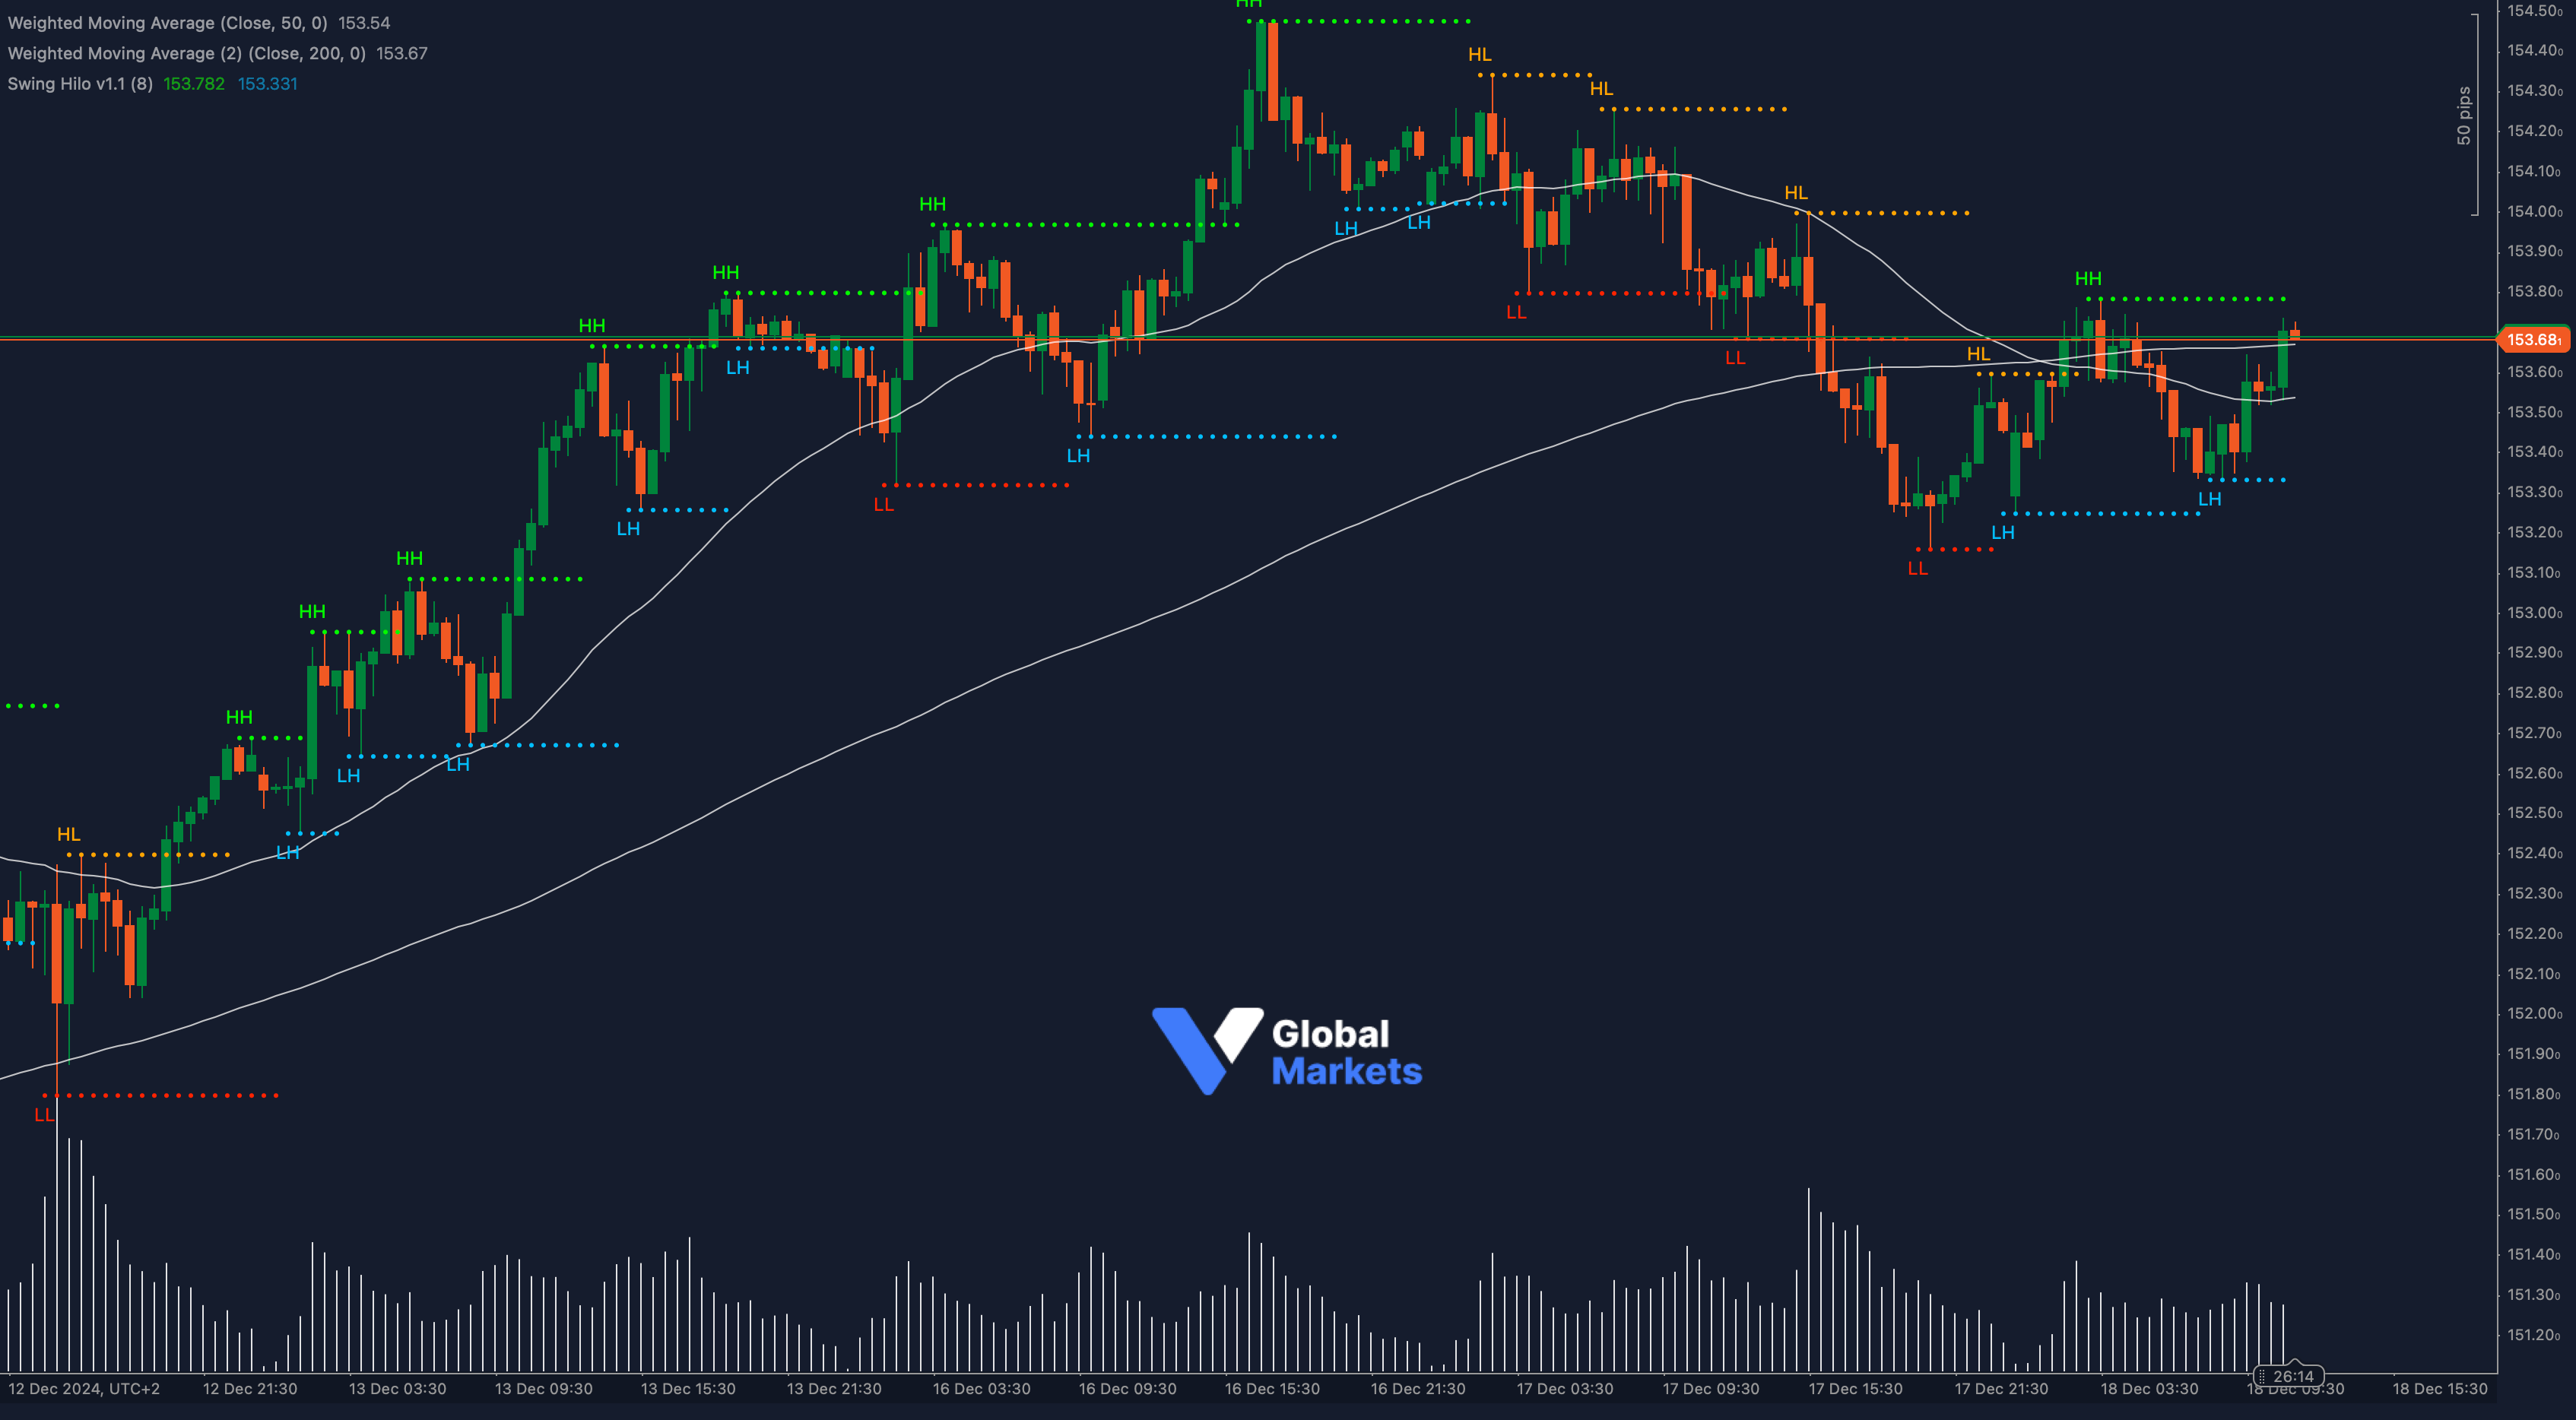
The USD/JPY pair is testing a decisive zone, with technical indicators hinting at a possible breakout or reversal. Traders are seeing a mix of bullish and bearish signals, making this an exciting chart to analyze. Key technical confluences are lining up, offering opportunities for sharp movements.
📊 The Fibonacci structure stands out clearly on this chart. The pair recently tested the 61.8% retracement zone of its previous decline near 153.80. This Fibonacci level serves as a critical inflection point. A successful breakout above it could open the door to the 154.40 extension level, while rejection may force a retest of lower supports at 153.20 and below.
💡 Weighted Moving Averages (WMAs) are painting an intriguing picture. The price is trading between the 50 WMA and 200 WMA, suggesting indecision and consolidation. However, the 50 WMA is beginning to slope upward, and any price close above this zone will signal a short-term bullish crossover. If confirmed, traders should watch for momentum to carry USD/JPY back toward its recent highs near 154.20.
📈 RSI momentum is building as it pushes higher from the midline. The current RSI level indicates a recovery phase, but the key lies in whether it can breach the 60 level. Sustained RSI strength above this threshold would validate the bullish case and support further upside toward the 154.50 resistance zone.
📍 The price action has also formed a short-term inverse head and shoulders pattern. This bullish reversal structure signals increasing buyer strength near the 153.20 support area, where the market bounced strongly. A neckline breakout at 153.80 aligns perfectly with the Fibonacci confluence and pivot zones, giving traders an actionable trade setup.
⚠️ On the fundamental front, USD/JPY remains sensitive to U.S. Treasury yields and Bank of Japan policy shifts. The recent rebound in U.S. bond yields has supported the Dollar, while the BOJ’s ultra-loose stance continues to keep the Yen under pressure. Traders should watch for any surprises in upcoming BOJ statements or U.S. economic data, particularly inflation and employment figures, which could drive sharp moves in the pair.
🌐 Global risk sentiment is another wildcard. If risk appetite picks up, USD/JPY could attract buyers, pushing the pair higher. Alternatively, a wave of risk-off sentiment might give the Yen some safe-haven demand, limiting upside moves.
The 153.80 resistance level is the key battleground right now. A confirmed breakout above this zone could see USD/JPY accelerate toward 154.40, supported by Fibonacci extensions and moving average signals. On the flip side, failure to break through might bring sellers back into play, targeting the 153.20 pivot and lower supports. Traders should keep a close watch on the RSI breakout and price action around the moving averages to confirm directional bias.
