Technical Analysis:
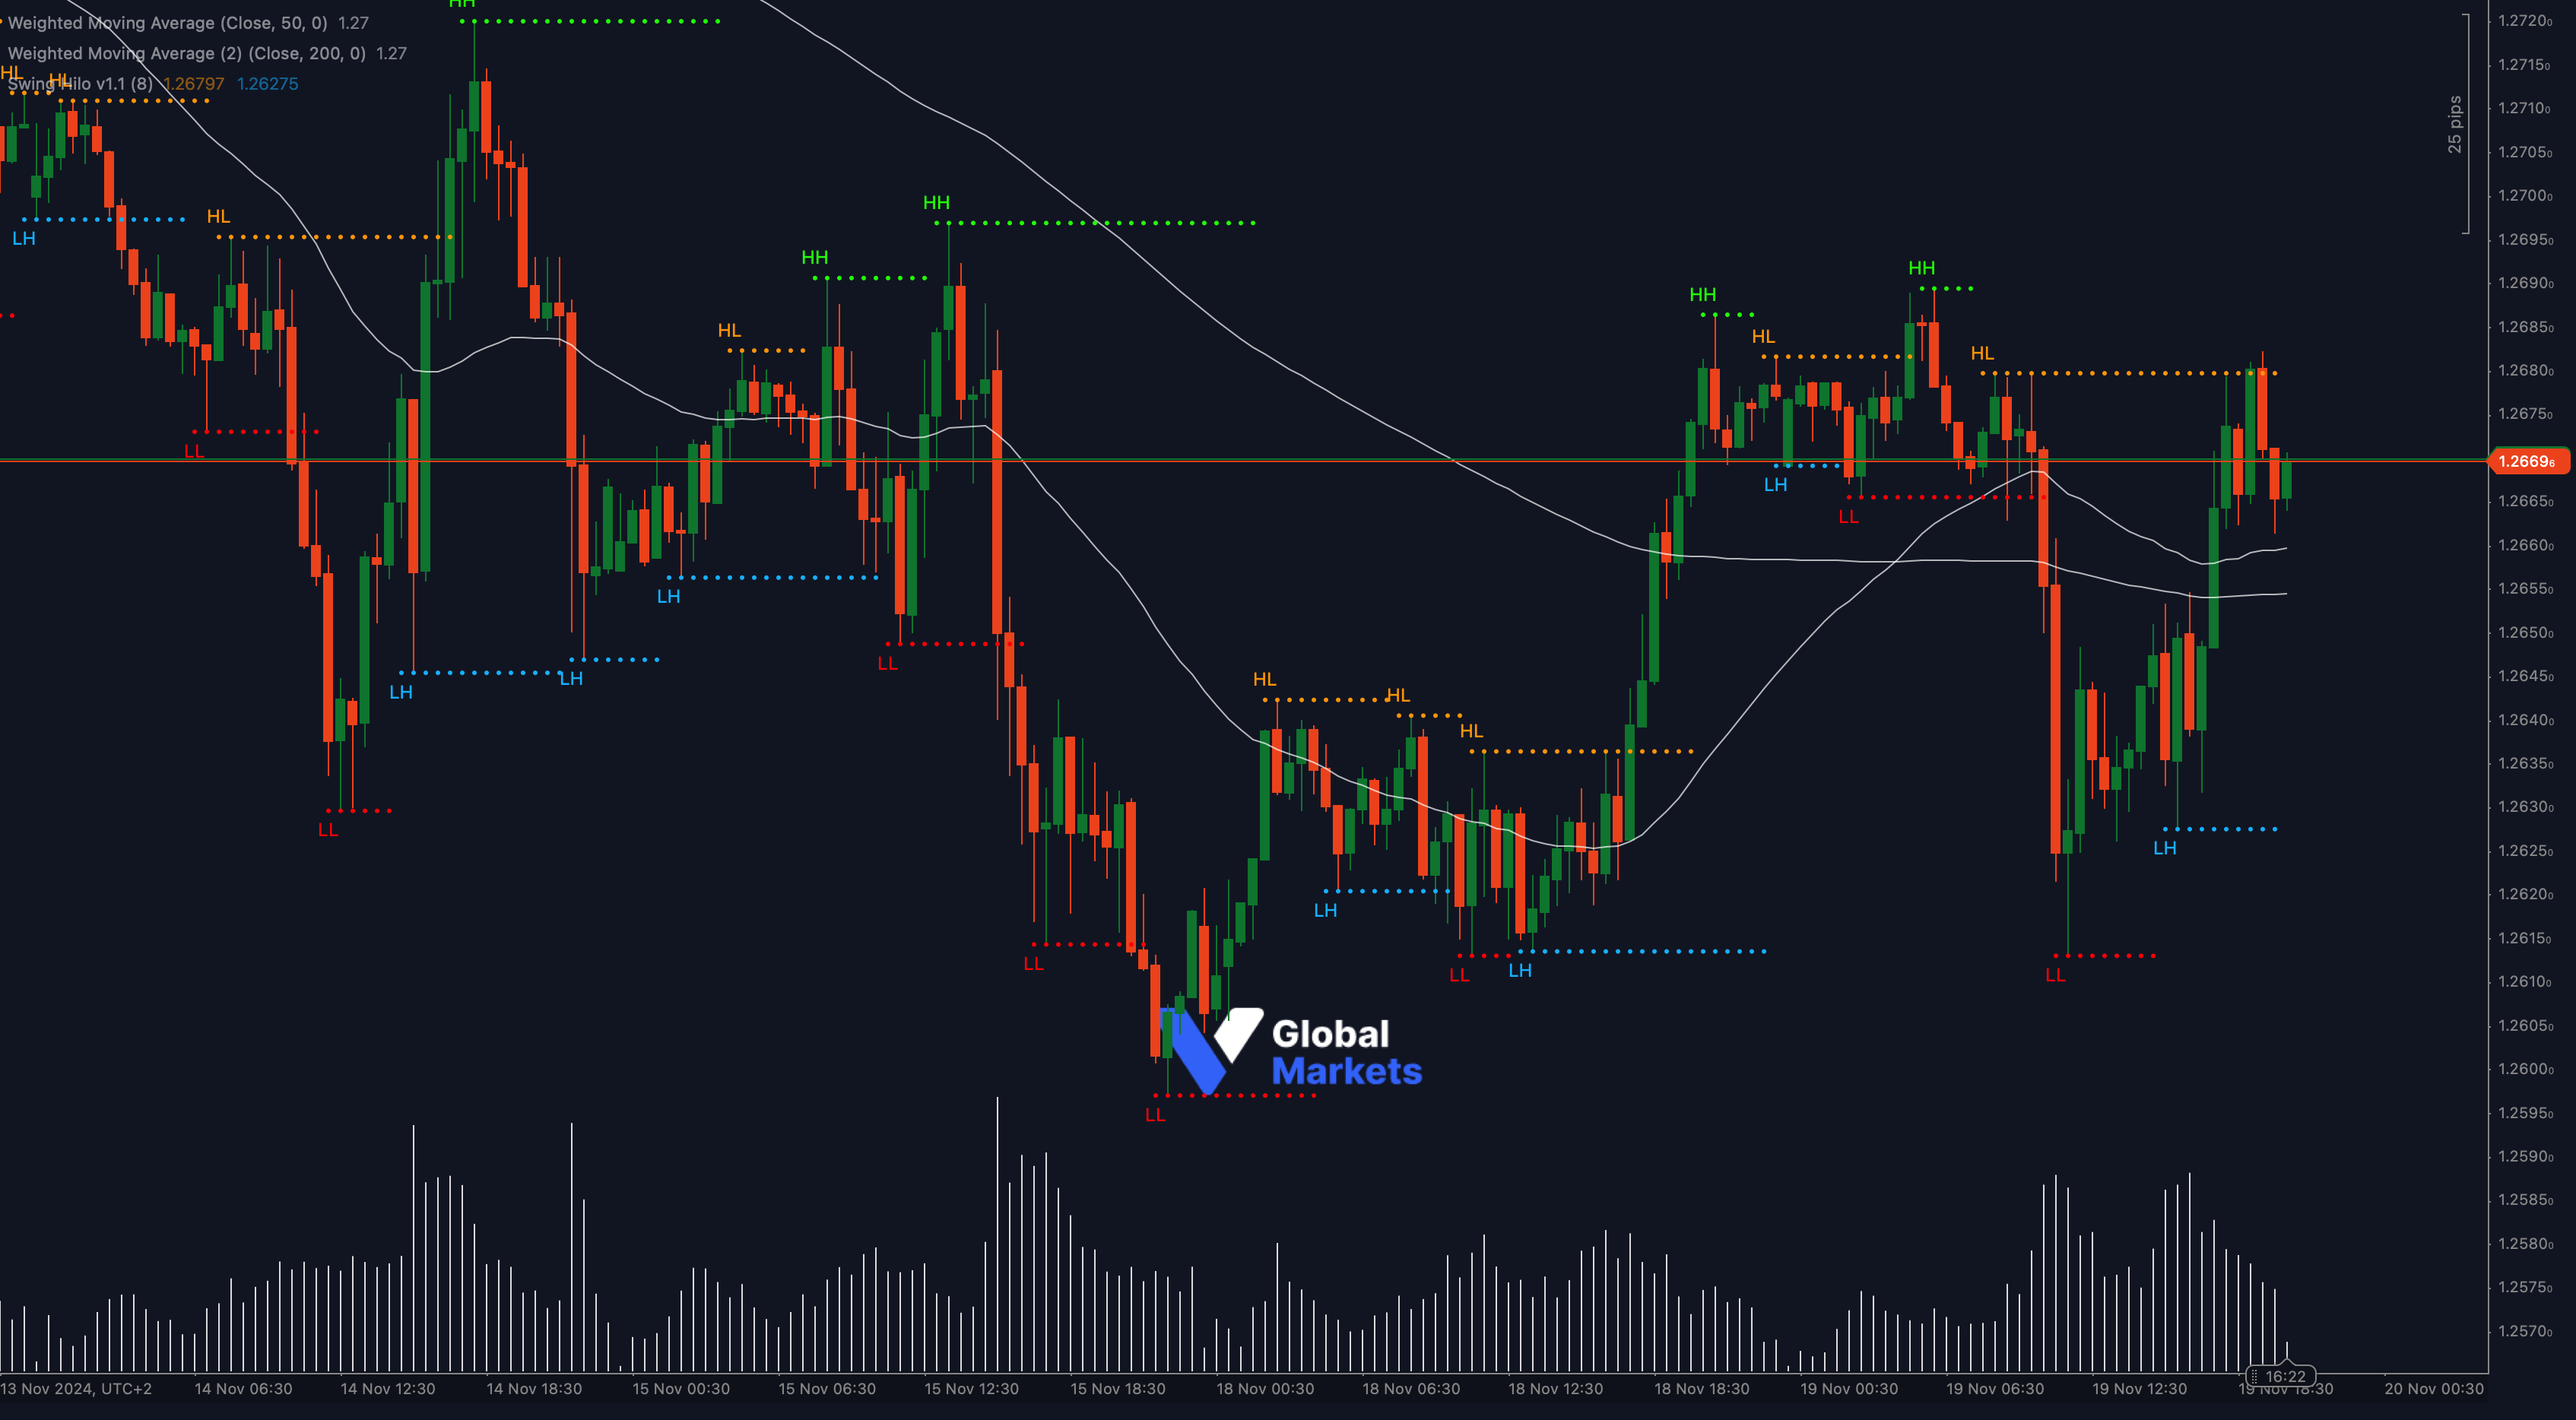
GBP/USD is trading near a pivotal level at 1.2690, following a strong recovery from the recent low of 1.2610. This price zone aligns with the 50% Fibonacci retracement of the recent decline from 1.2770 to 1.2610, highlighting its significance as a battleground for bulls and bears.
The Moving Average Convergence Divergence (MACD) shows a subtle upward crossover, signaling growing bullish momentum. At the same time, the Relative Strength Index (RSI) is near 58, suggesting room for additional gains without entering overbought conditions.
Price action shows a developing inverse head-and-shoulders pattern, with 1.2690 serving as the neckline. A break above this level could signal a potential target around 1.2740, corresponding to the 61.8% Fibonacci retracement. On the downside, failure to sustain above 1.2690 could lead to a retest of the support at 1.2650, followed by the key swing low of 1.2610.
Key Levels to Watch:
- Support: 1.2650, 1.2610
- Resistance: 1.2690, 1.2740
Volume and Sentiment:
📊 Volume has shown an uptick during the recovery phase, reflecting increasing interest. Watch for a volume surge at 1.2690 to confirm a directional breakout.
Outlook:
GBP/USD is at a crucial point, with technical indicators leaning slightly bullish. A sustained move above 1.2690 could open the path for higher levels, while rejection at this zone may invite further selling pressure.
Fundamental Analysis:
The GBP/USD pair remains influenced by diverging economic outlooks in the UK and US. While expectations of a Bank of England pause in rate hikes weigh on the pound, the dollar has been steady amid speculation of prolonged Fed tightening. This week’s economic data releases, including UK inflation and US jobless claims, will likely determine near-term direction.
#GBPUSD #ForexAnalysis #TechnicalAnalysis #ForexMarket #TradingStrategy #ctrader #CurrencyPairs #MarketUpdate
