Technical Analysis:
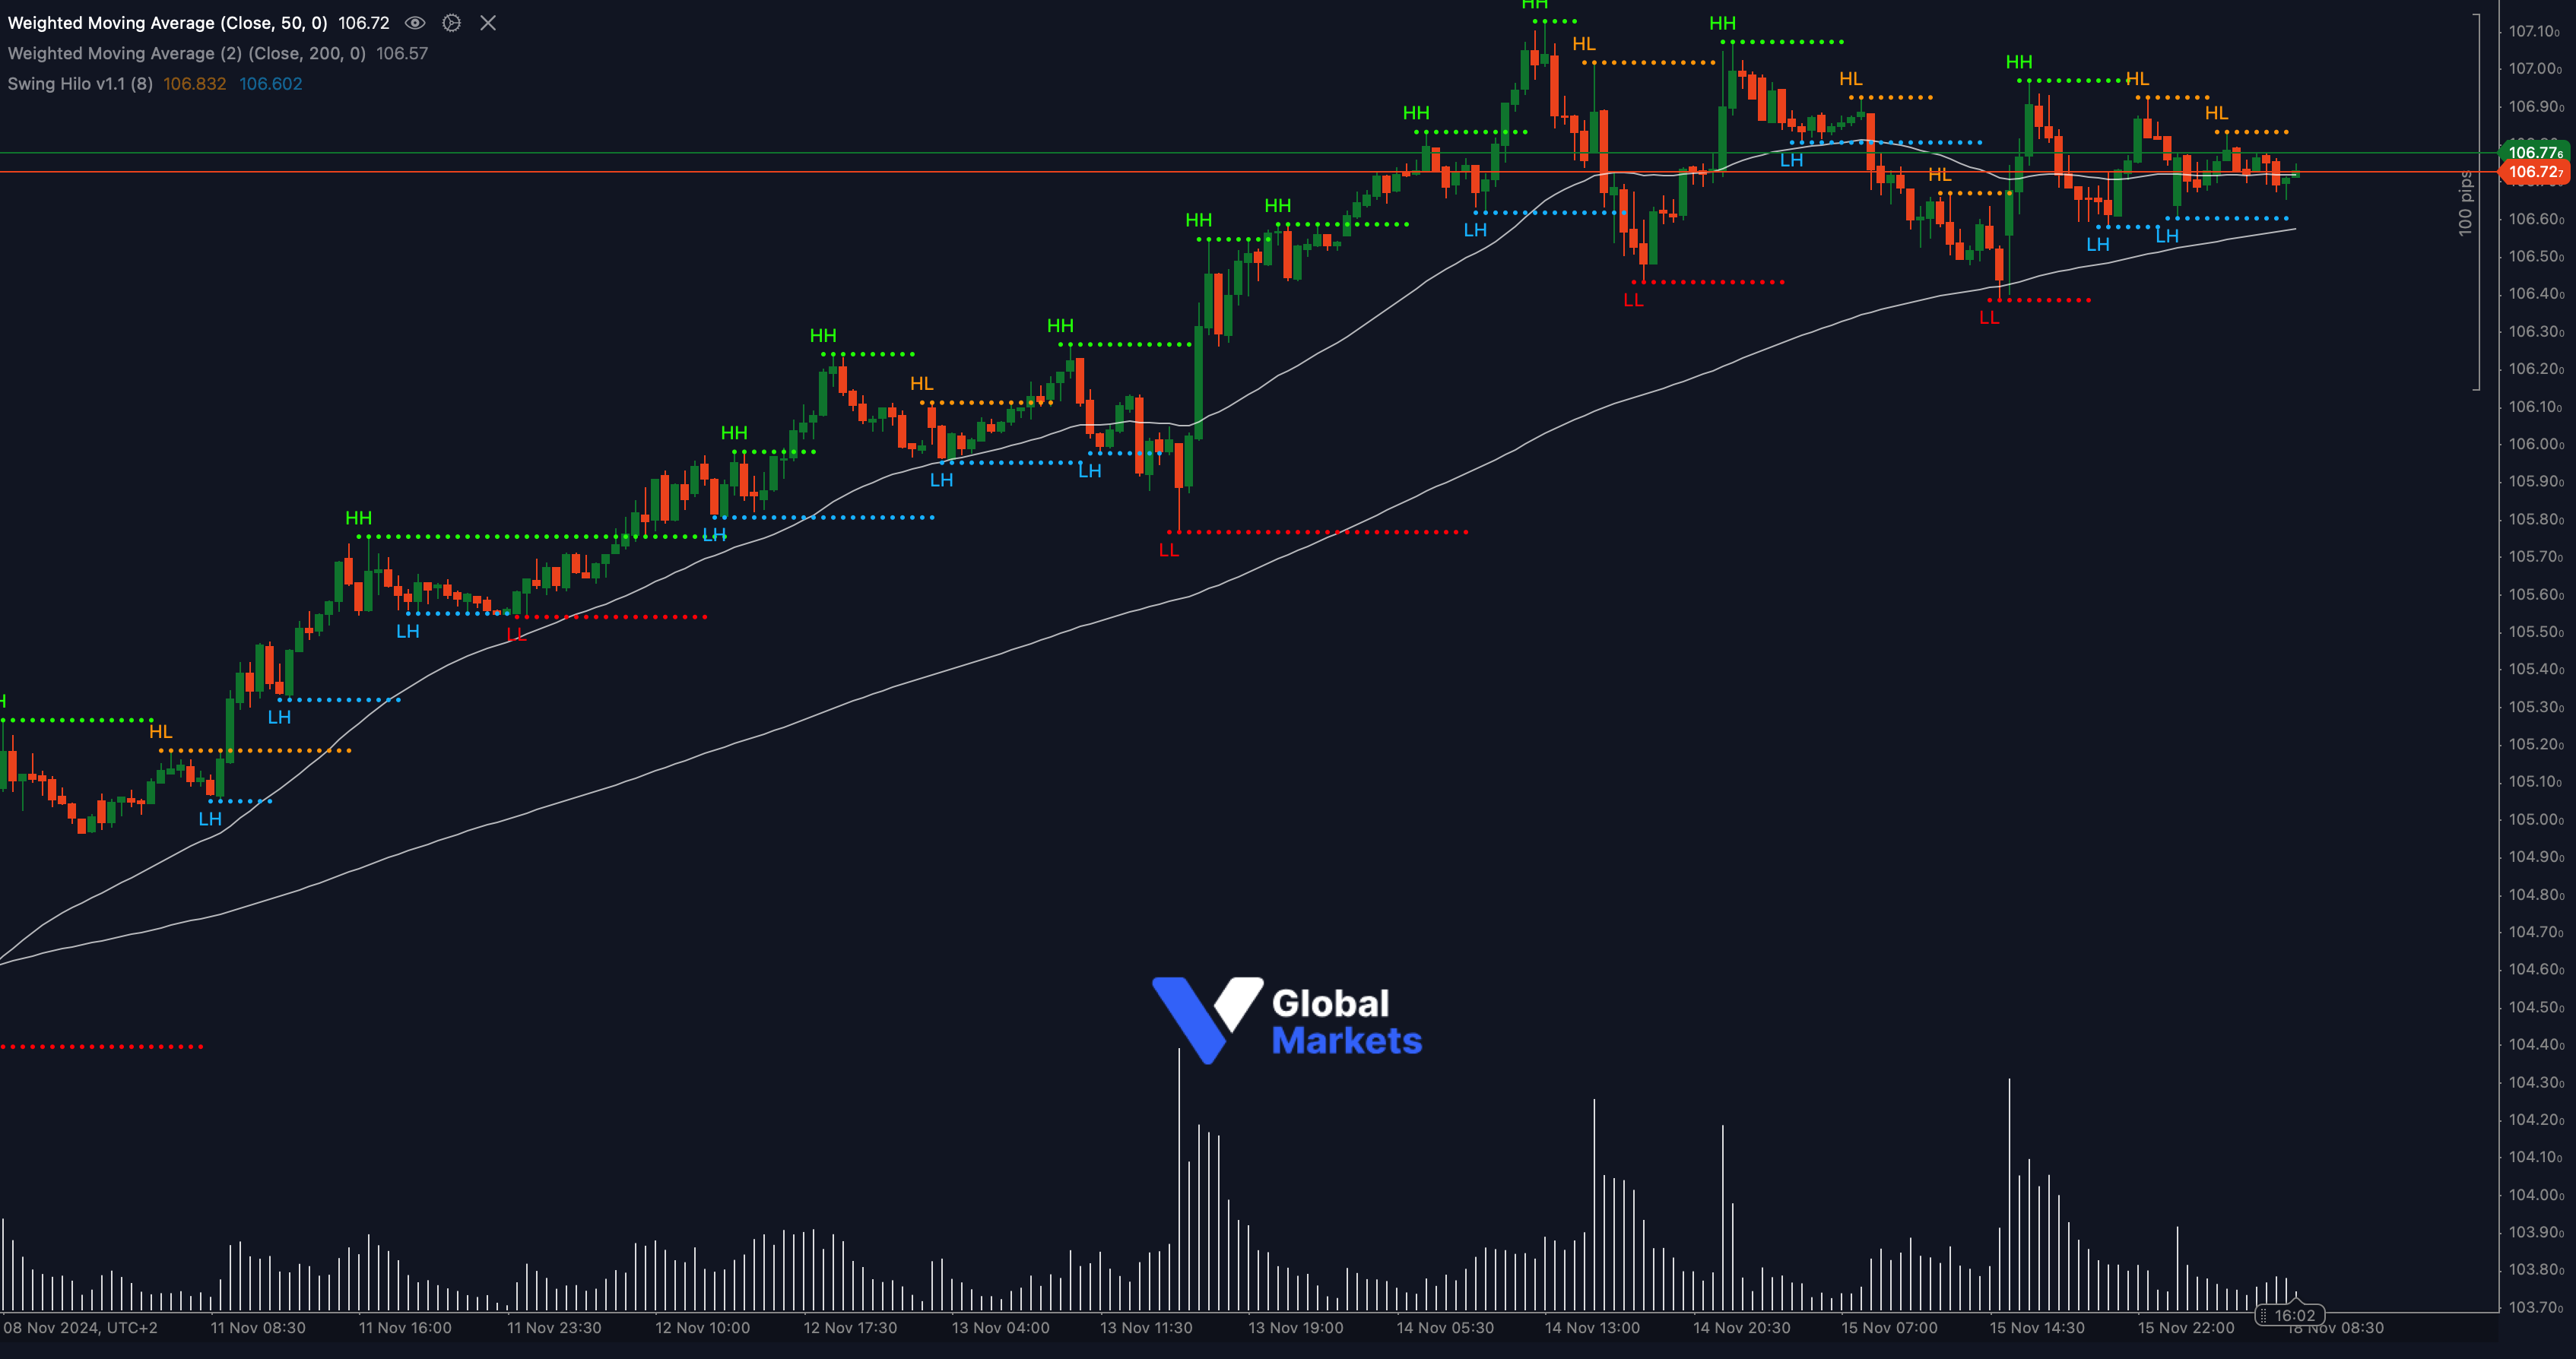
The US Dollar Index (DXY) is currently hovering below a critical resistance level at 106.77. The 50-period WMA (106.72) and the 200-period WMA (106.57) are tightly aligned, indicating a key inflection zone. The index is moving sideways after a strong bullish run, forming a potential consolidation pattern with alternating higher highs (HH) and lower highs (LH).
A breakout above 106.77 could push the DXY towards higher targets such as 107.00 and 107.20, signaling renewed bullish momentum. On the other hand, failure to clear this resistance may see the index retest support around 106.50 and 106.30.
Support: 🔻 106.50, 106.30
Resistance: 🔺 106.77, 107.00
Moving Averages:
📉 DXY is consolidating near both the 50-WMA and 200-WMA, which form a crucial resistance zone. A decisive move above these levels could confirm bullish continuation, while rejection may signal a deeper pullback.
Volume:
📊 Volume has been relatively muted during the consolidation, but any significant breakout or breakdown could see a notable spike, signaling directional bias.
Key Levels to Watch:
Support: 106.50, 106.30
Resistance: 106.77, 107.00
Outlook:
🚩 The DXY appears to be at a tipping point. A breakout above 106.77 could ignite bullish momentum, while a rejection at this level might lead to further consolidation or downside.
Fundamental Analysis:
The DXY remains influenced by economic data releases and Federal Reserve policy signals. Market participants are closely monitoring inflation data and upcoming Fed communications for clues on the next move. Recent resilience in the USD reflects ongoing global uncertainty and strong demand for safe-haven assets.
#DXY #USDIndex #ForexAnalysis #TechnicalAnalysis #ForexMarket #Trading #VGlobalMarkets #MarketOutlook #ctrader
