echnical Analysis:
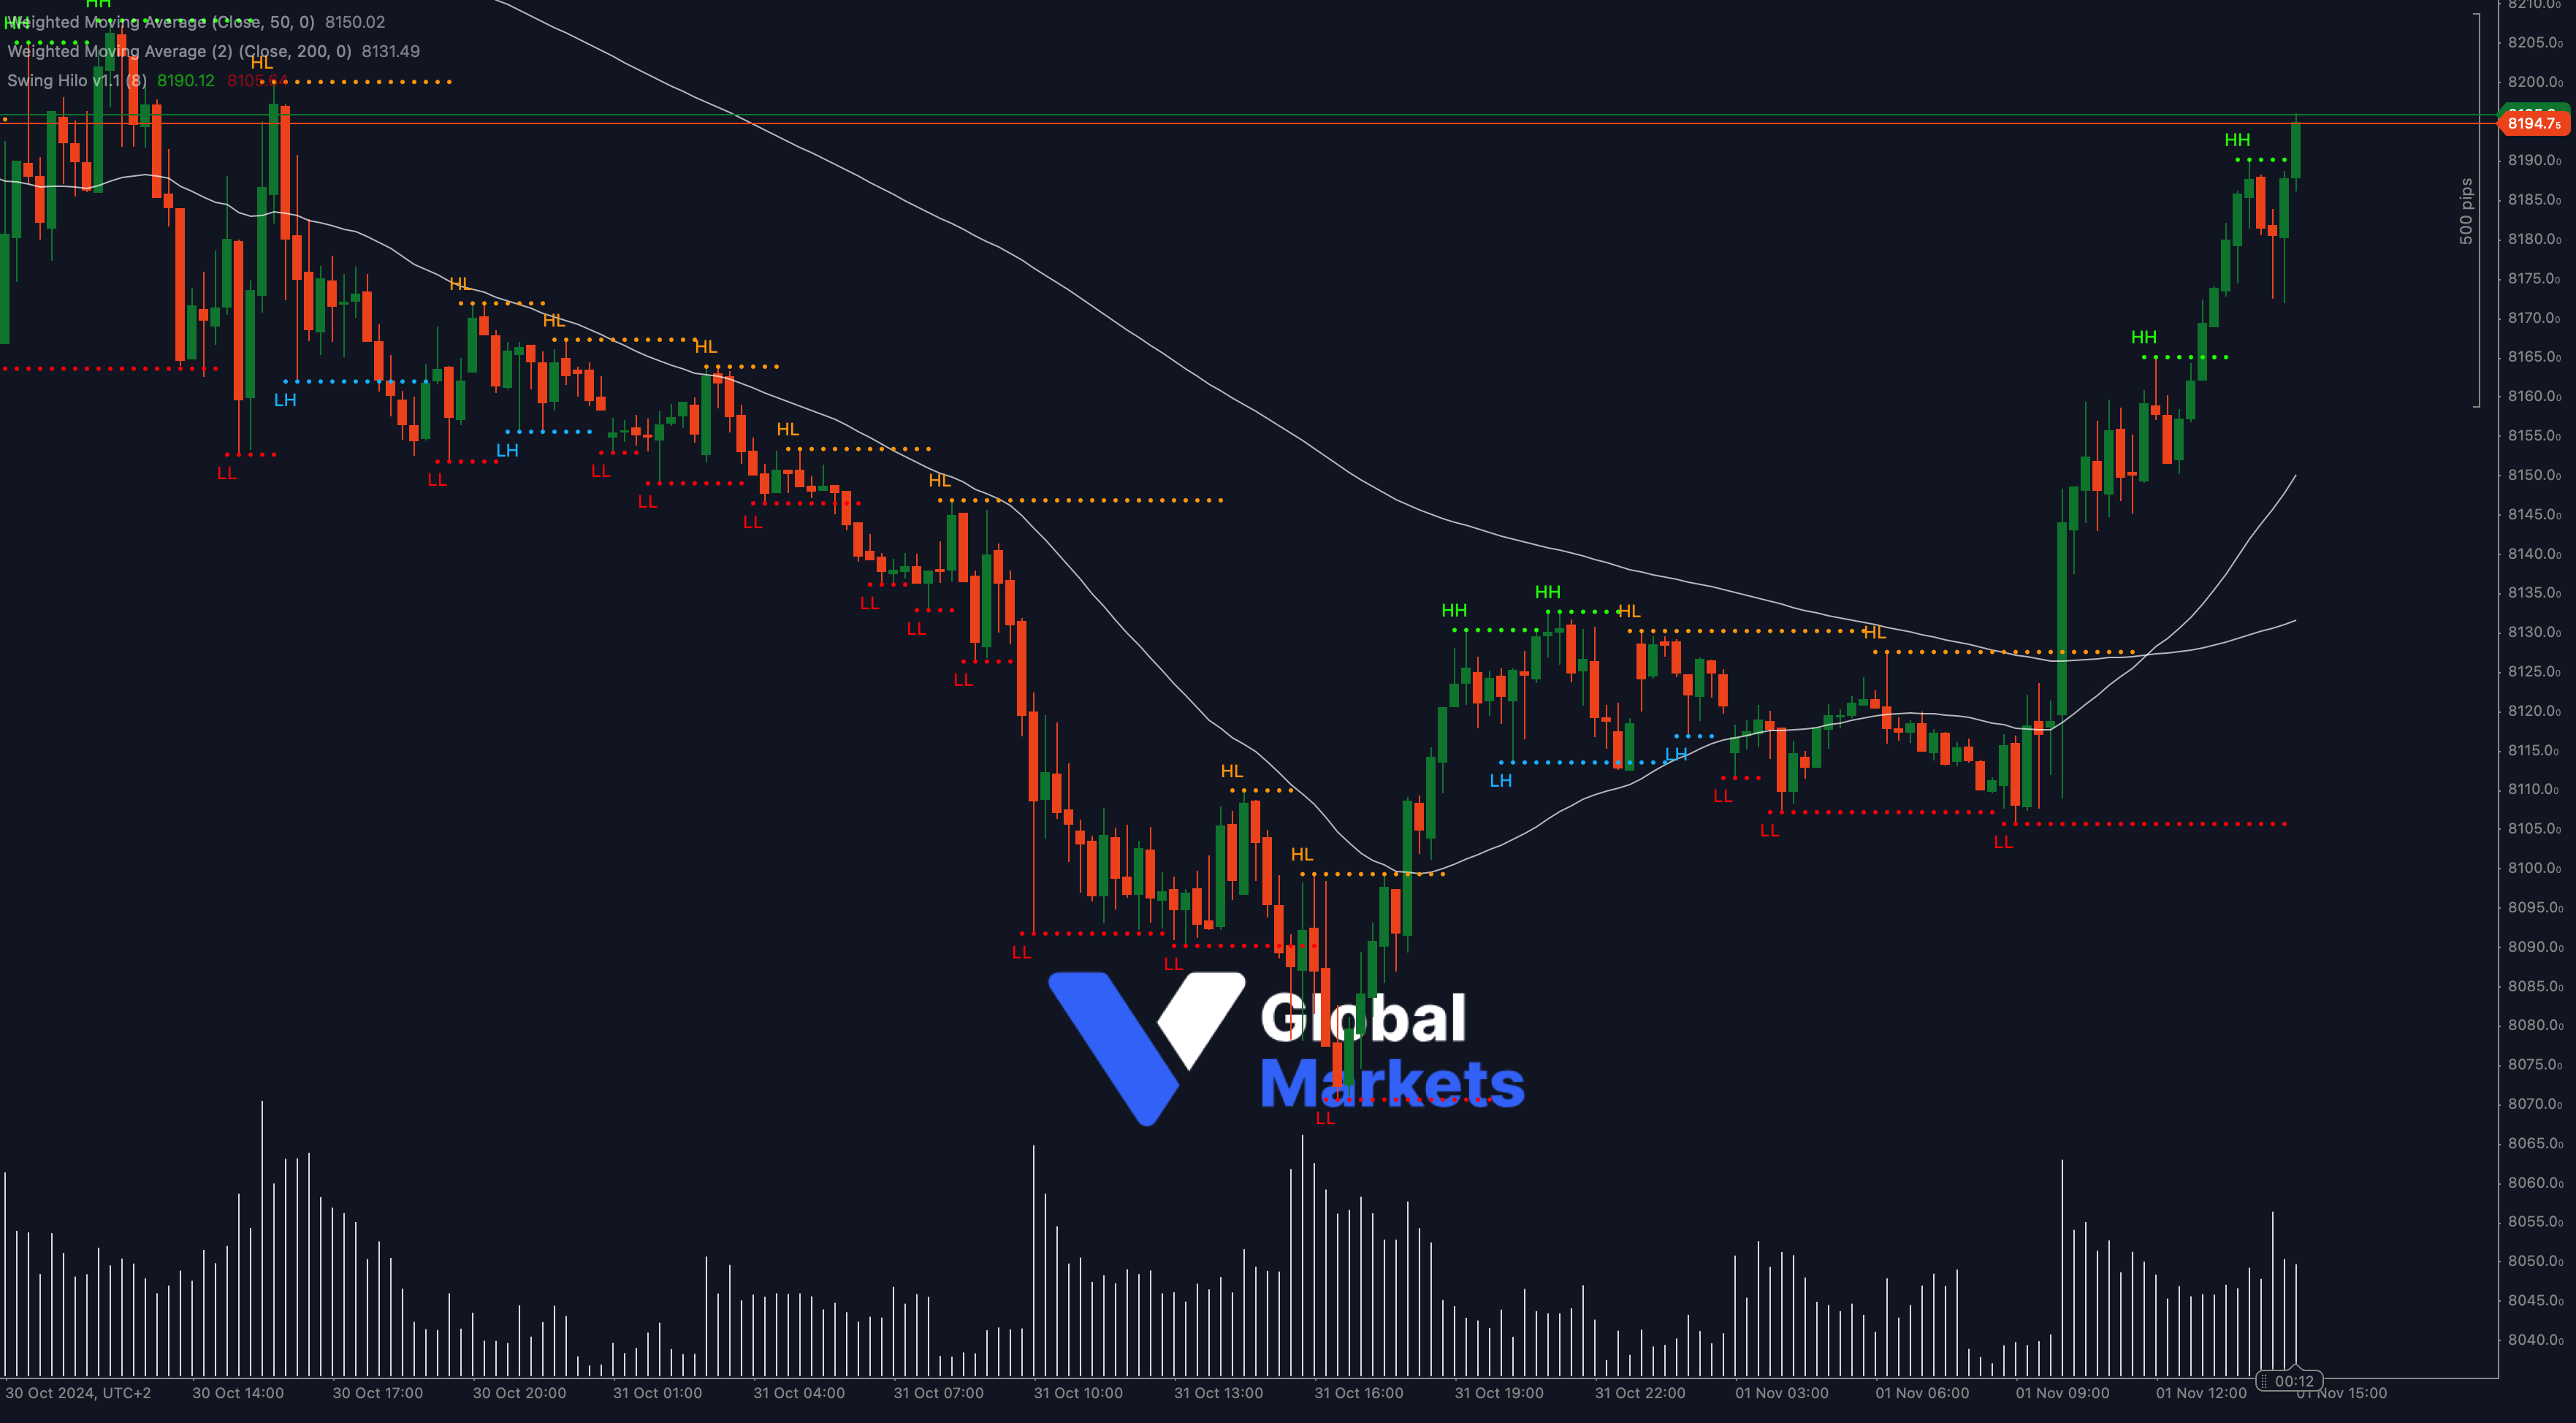
The UK 100 is currently trading around 8190.12, challenging a key resistance level. This surge in buying interest has brought the index to both the 50-period and 200-period Weighted Moving Averages (WMAs), located at 8150.02 and 8131.49 respectively, signaling potential bullish momentum. If the index can break and hold above this resistance, further upward movement might be anticipated.
A successful breakout above 8190.12 could pave the way towards the next target at 8230, while a reversal may find support around 8150 and 8131, aligning with the 50-WMA and 200-WMA, respectively.
Support: 🔻 8150, 8131
Resistance: 🔺 8190.12, 8230
Moving Averages:
📉 The UK 100 index has reached both its 50-WMA and 200-WMA, signaling potential for a bullish breakout. A sustained close above these levels would confirm buying pressure, while a failure to hold could see a return to bearish sentiment.
Volume:
📊 The trading volume has spiked as the index approached 8190.12, suggesting strong buyer interest. Continued volume increases may support a breakout scenario.
Key Levels to Watch:
Support: 8150, 8131
Resistance: 8190.12, 8230
Outlook:
🚩 The UK 100 is at a crucial resistance level. A break above 8190.12 would signal strong bullish momentum, while failure to breach could lead to a pullback. Traders should closely monitor these levels as they may define the index’s next direction.
Fundamental Analysis:
The UK 100 is benefiting from recent global market optimism, along with improved UK economic data. However, traders remain cautious due to ongoing inflation concerns and central bank policies. Any shifts in global economic sentiment or changes in UK economic indicators could heavily influence the index’s next move.
#UK100 #StockMarket #TechnicalAnalysis #BullishTrend #FTSE100 #UKMarkets #VGlobalMarkets #TradingStrategy #Forex #ctrader
