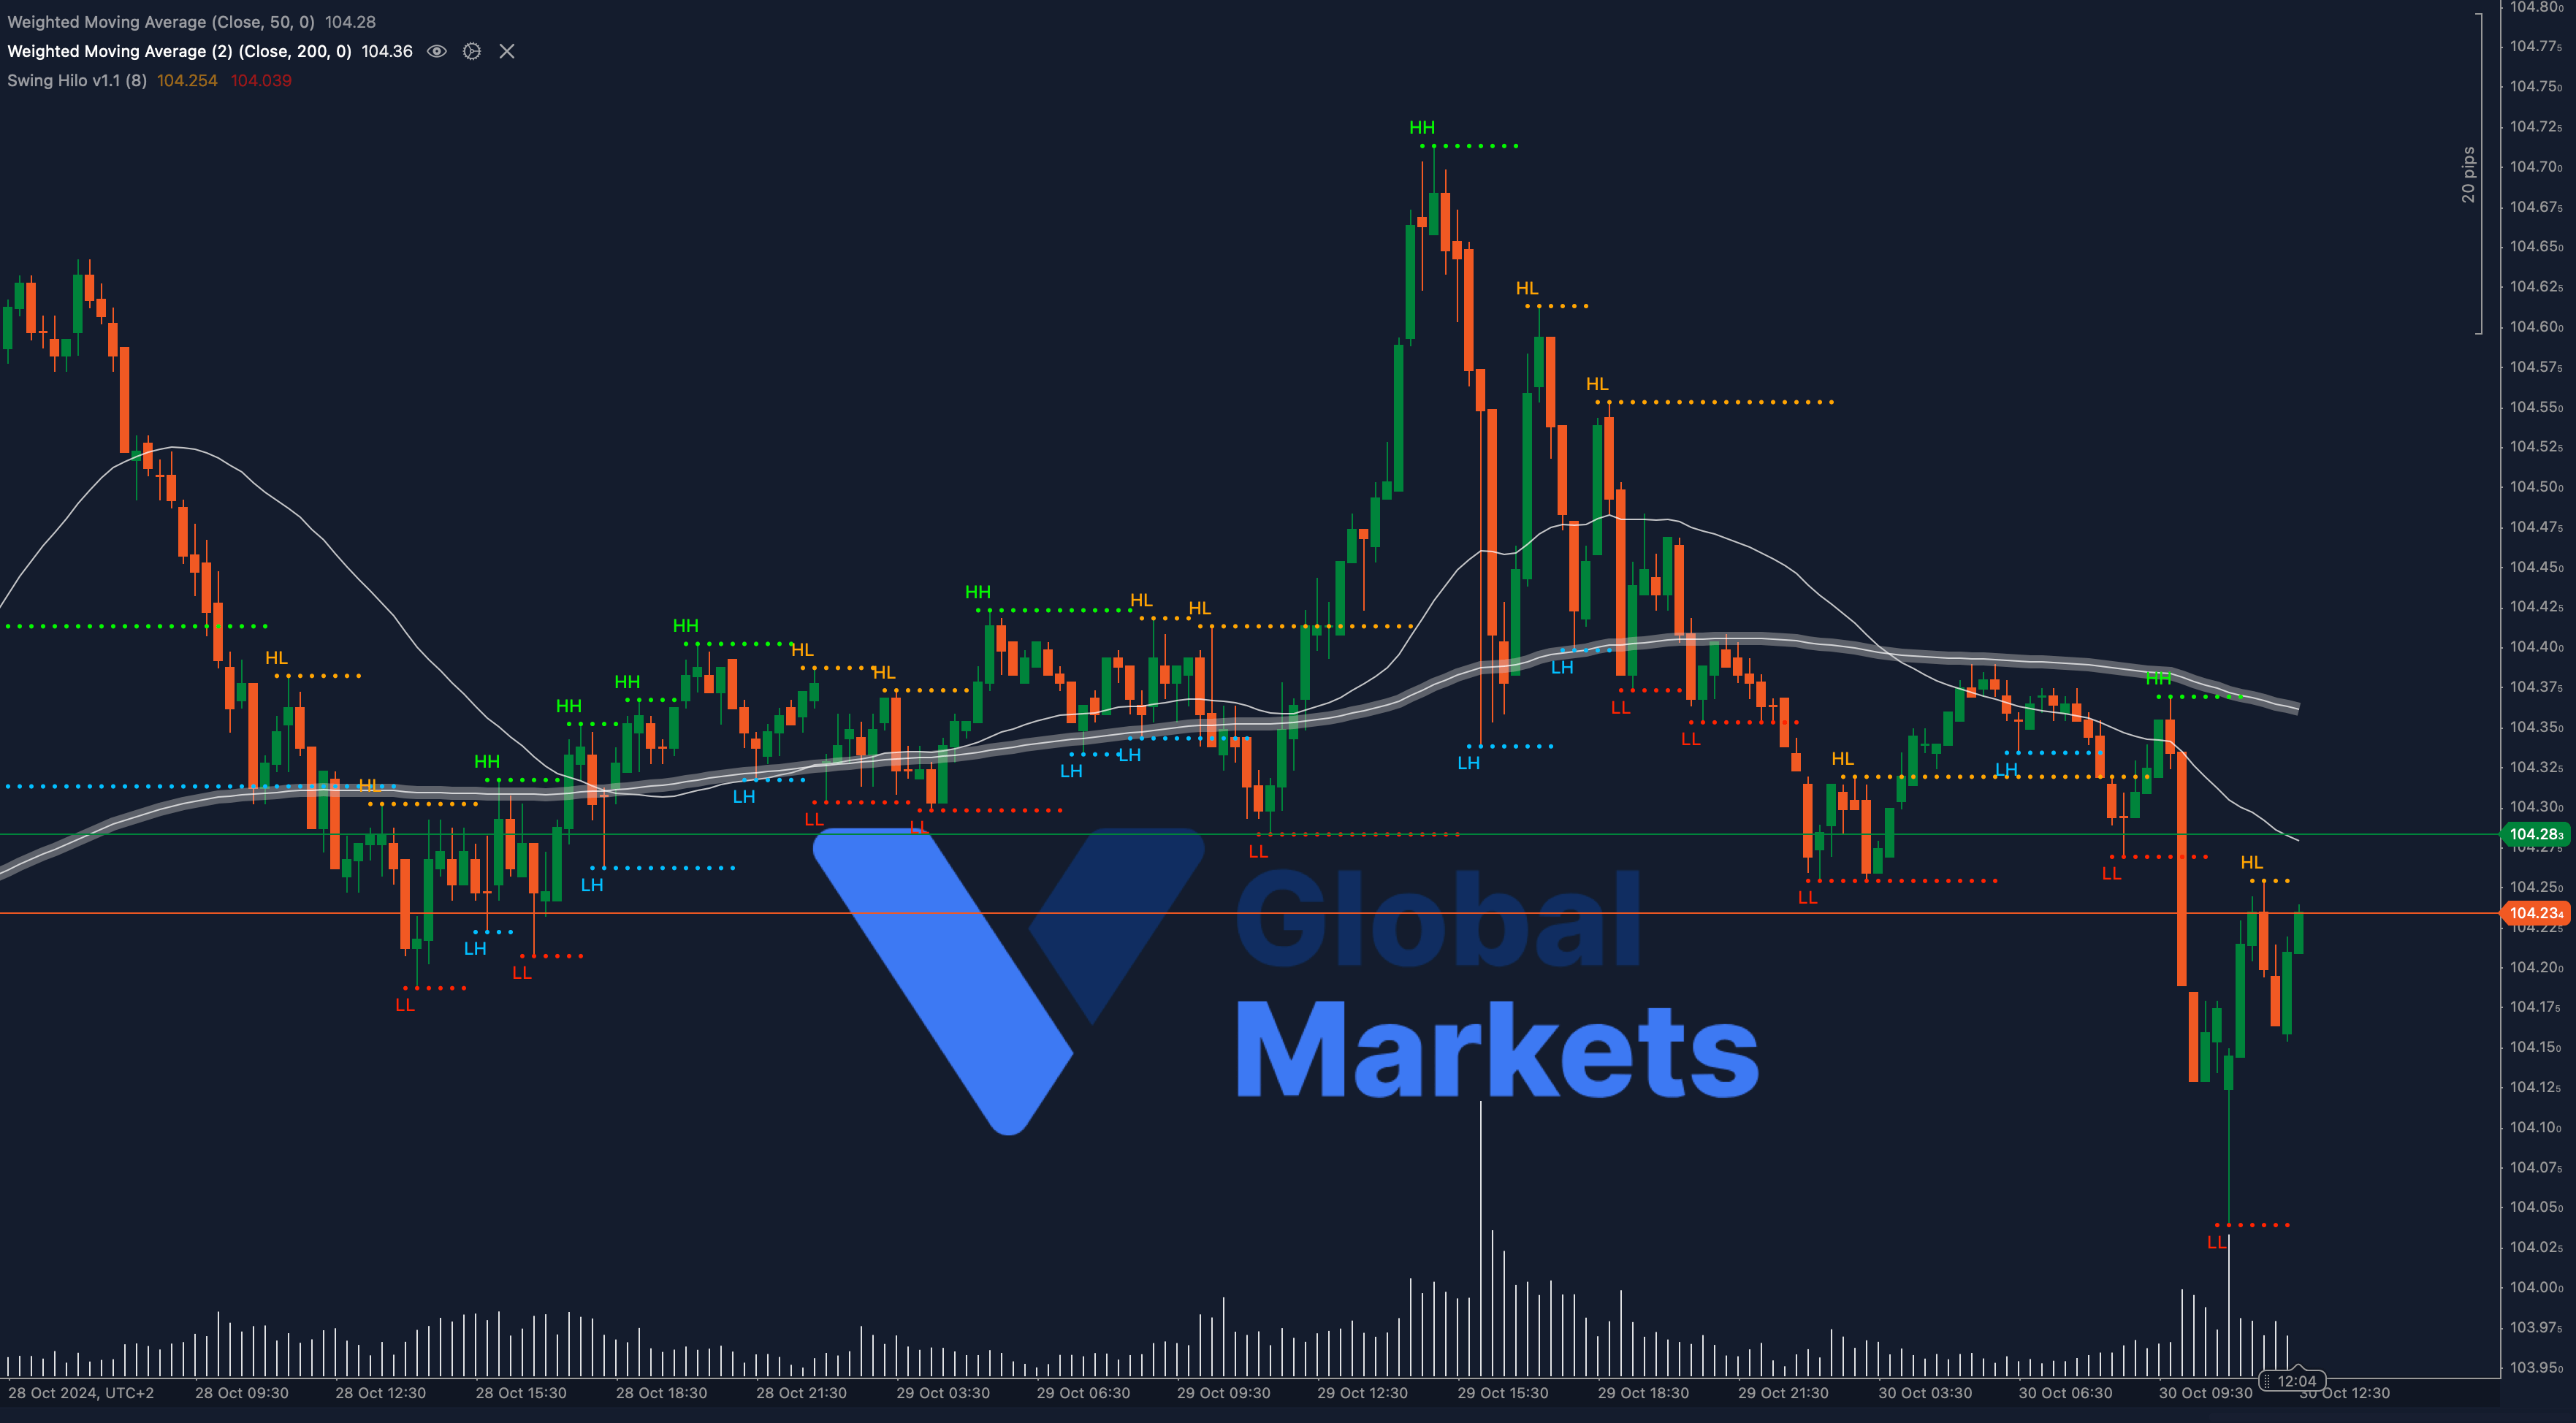
Technical Analysis: 💵 The US Dollar Index (DXY) is currently trading around $104.28, close to a critical support level at $104.25. The 50-WMA is positioned at $104.28 and the 200-WMA at $104.36, creating a resistance zone above. The recent price action reflects a consolidation phase, with the index attempting to stabilize after the recent dip.
A decisive break below $104.25 could lead to further declines, targeting support around $104.00. Alternatively, if DXY holds and moves above $104.36, a potential bullish recovery towards $104.50 might unfold.
Support: 🔻 $104.25, $104.00
Resistance: 🔺 $104.28 (50-WMA), $104.36 (200-WMA)
Moving Averages: 📊 DXY hovers around its 50-WMA and 200-WMA, indicating a neutral stance. A sustained move above these levels may trigger a bullish outlook, while failure to hold could reinforce bearish sentiment.
Volume: 📉 Volume has been moderate, showing indecision among traders. A spike in volume on a breakout above $104.36 would validate bullish strength, while increased selling below $104.25 may signal a continuation of the downtrend.
Key Levels to Watch:
Support: $104.25, $104.00
Resistance: $104.28 (50-WMA), $104.36 (200-WMA)
Outlook: 🔍 The US Dollar Index is at a pivotal point. A break above $104.36 could signal a short-term recovery, while a drop below $104.25 might confirm further downside. Traders should closely monitor these levels as they could dictate the next directional move for DXY.
Fundamental Analysis: 🌍 The US Dollar remains influenced by global risk sentiment and Federal Reserve policy expectations. Any shifts in economic data or Fed statements could sway the market, with inflationary pressures and geopolitical factors continuing to add uncertainty.
#DXY #USDollar #ForexMarket #TechnicalAnalysis #VGlobalMarkets #USDIndex #ForexTrading #MarketAnalysis #EconomicIndicators
