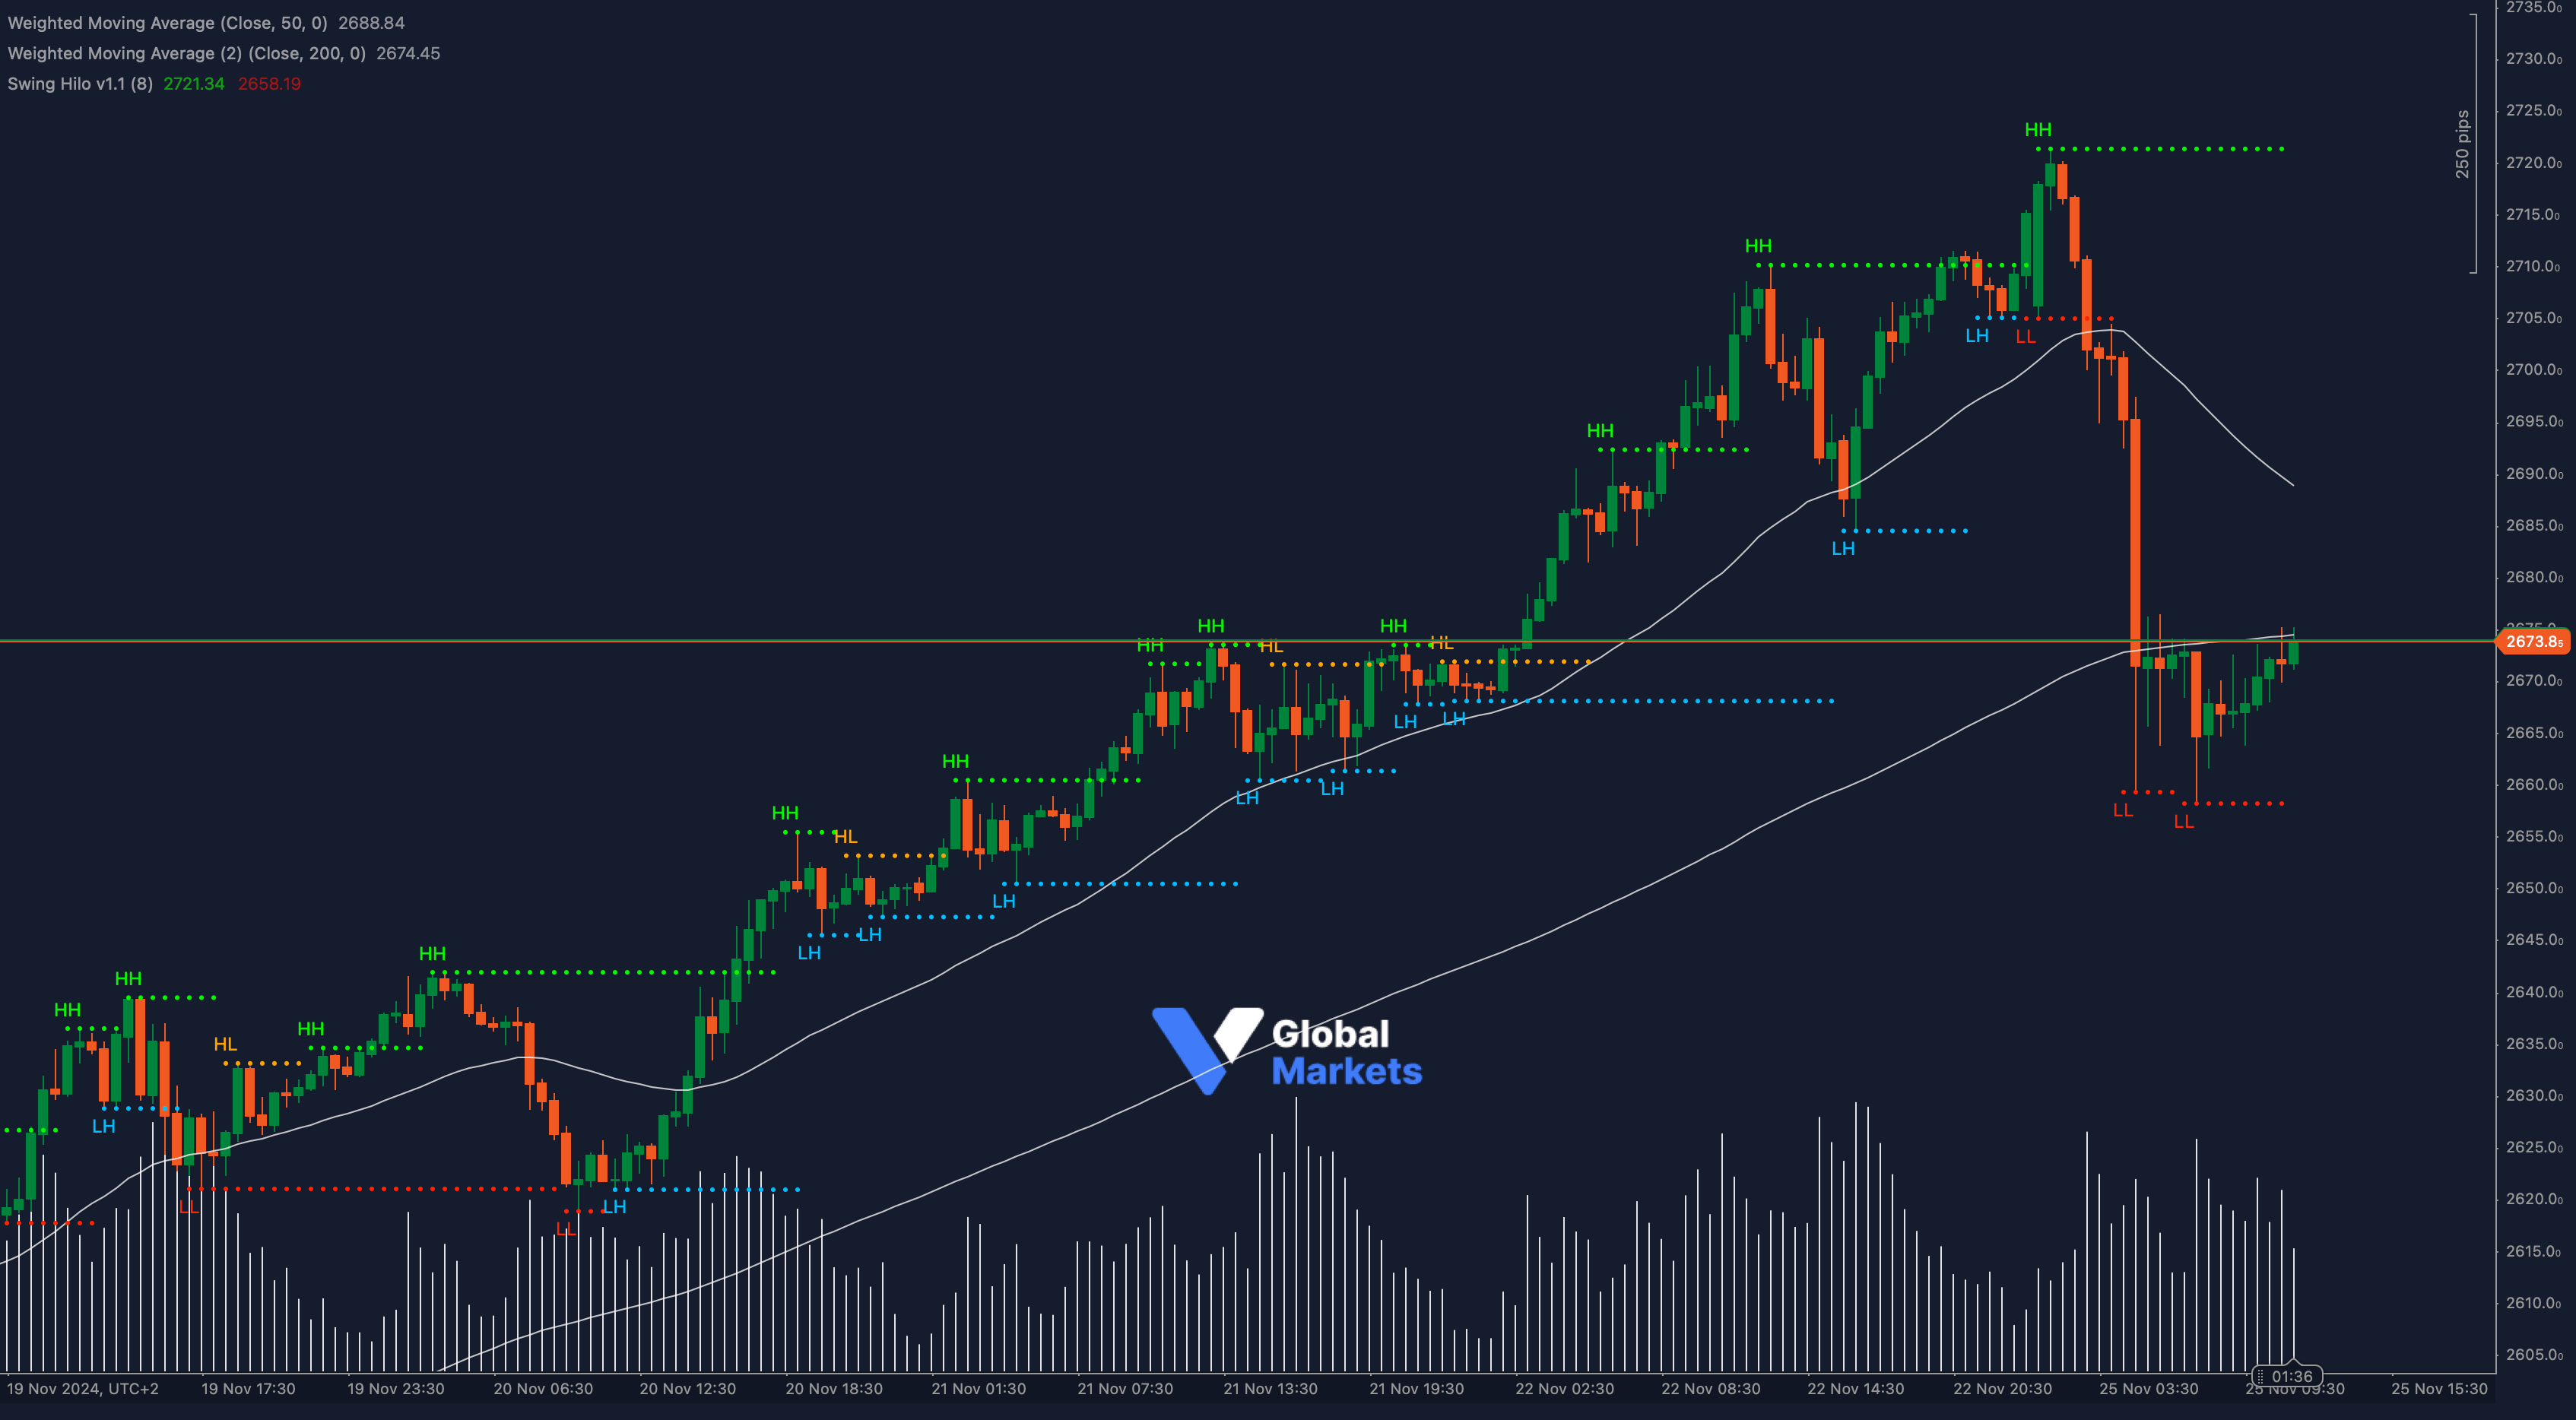
Technical Analysis:
Gold (XAU/USD) is currently trading near 2673.80, a level that has acted as a critical pivot in recent sessions. This price aligns closely with the 50% Fibonacci retracement of the sharp decline from 2721.34 to 2658.19, suggesting a possible decision point for market participants.
The Bollinger Bands are narrowing, indicating reduced volatility and potential consolidation before the next directional move. The RSI (Relative Strength Index) is hovering near 45, reflecting neutral momentum but leaning bearish after the recent drop. Meanwhile, the MACD histogram shows signs of a potential bullish crossover, hinting at a possible recovery attempt.
A break above 2673.80 could see XAU/USD retest 2690 (61.8% Fibonacci level) and potentially move toward 2705, a recent resistance area. On the downside, if the price fails to sustain above 2673.80, it could revisit support at 2660, followed by the critical low at 2658.19.
Key Levels to Watch:
- Support: 2660, 2658.19
- Resistance: 2673.80, 2690
Volume and Sentiment:
📊 Volume spiked during the recent decline, signaling strong selling pressure. However, reduced volume during the consolidation suggests a temporary pause in directional conviction.
Outlook:
XAU/USD is at a crossroads near 2673.80, with technical indicators providing mixed signals. Traders should watch for a breakout from this level, as it will likely determine the next significant move for gold prices.
Fundamental Analysis:
Gold remains influenced by shifting risk sentiment and dollar strength amid ongoing global economic uncertainty. Market participants are closely monitoring upcoming US economic data and Federal Reserve comments for clues on interest rate trajectories, which are pivotal to gold’s direction.
#XAUUSD #GoldTrading #TechnicalAnalysis #ForexMarket #TradingStrategy #ctrader #PreciousMetals #MarketOutlook
